Interactive COVID-19 data exploration with Jupyter notebooks
In these challenging times, we have all experienced the impact of the COVID-19 pandemic, either directly or through the measures taken to contain its spread. With an abundance of COVID-19 data available from public sources, I have developed a straightforward Jupyter notebook that enables the interactive exploration of this data. You can select the data from a specific country and visualize different aspects of the pandemic, such as the number of confirmed cases, the number of deaths, and number of vaccinations. The source of the data is a csv table provided by covid.ourworldindata.orgꜛ. Please find the notebook in this GitHub repositoryꜛ and feel free to utilize and share it.
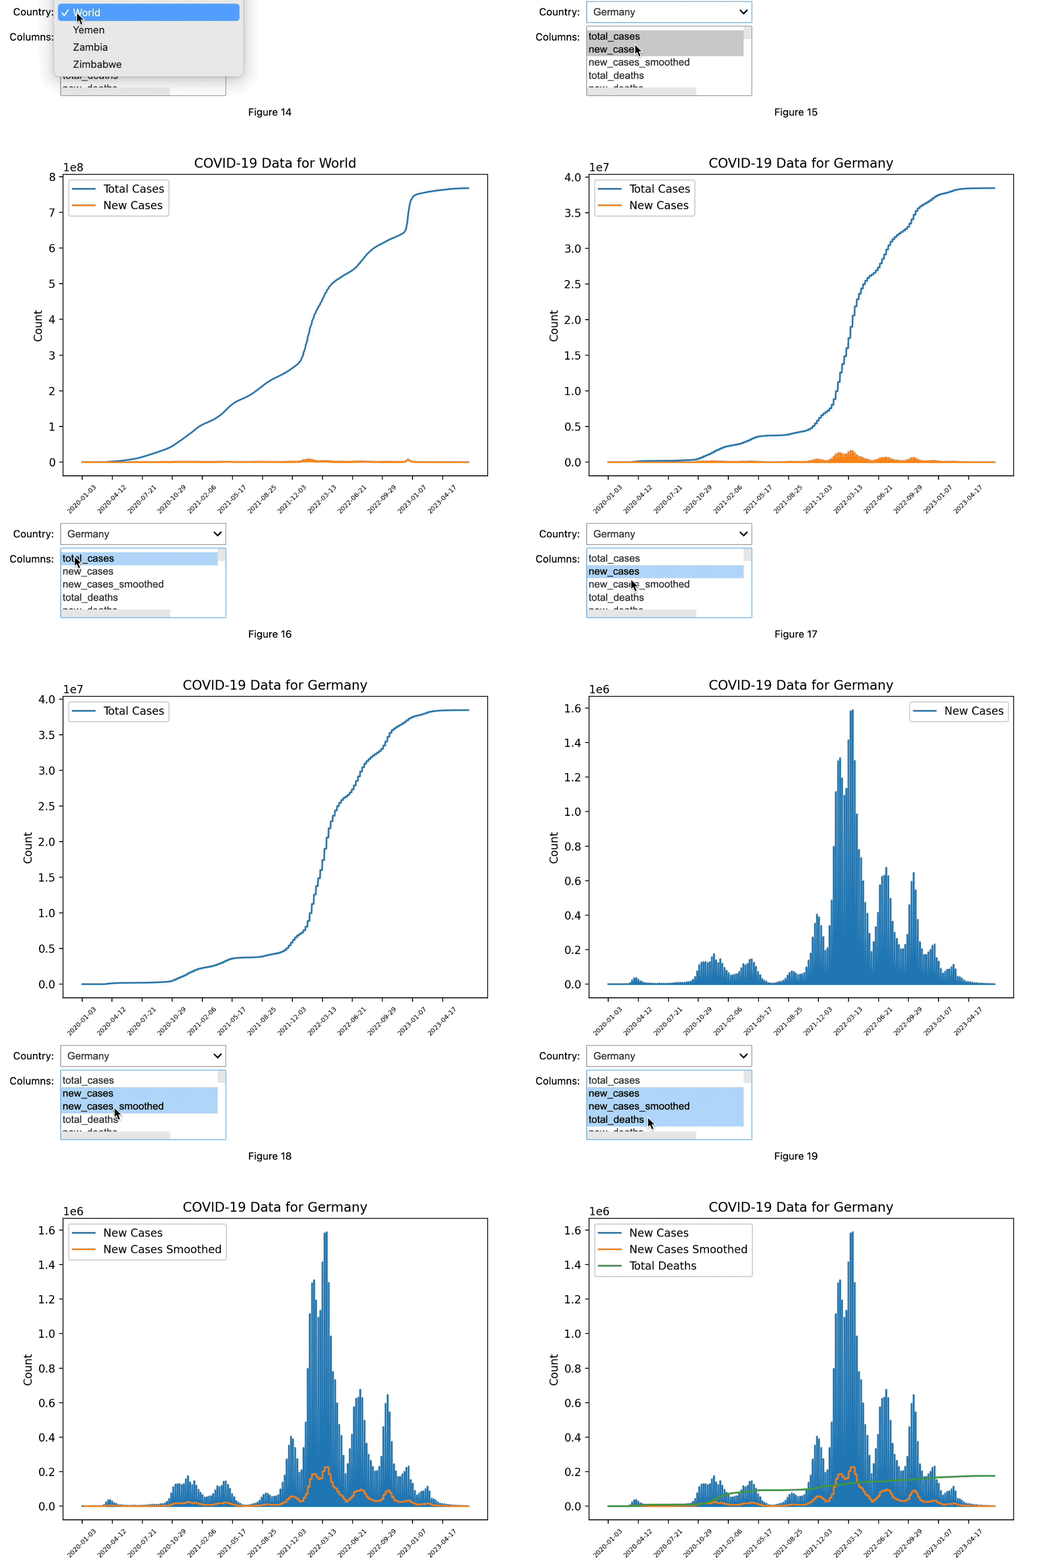 The interactive COVID-19 data exploration notebook.
You can also run the notebook in Google Colab or Binder by clicking on one of the buttons below:
Here is the code:
import matplotlib.pyplot as plt
import ipywidgets as widgets
from IPython.display import display
import pandas as pd
import mplcursors

# Load data
url = "https://covid.ourworldindata.org/data/owid-covid-data.csv"
df = pd.read_csv(url)


# Create interactive widgets
country_dropdown = widgets.Dropdown(
    options=df['location'].unique(),
    value='World',
    description='Country:'
)

columns_checkbox = widgets.SelectMultiple(
    options=list(df.columns[4:]),
    value=['total_cases', 'new_cases'],
    description='Columns:'
)

# Plotting function
def plot_data(country, columns):
    plt.figure(figsize=(7, 5))
    selected_data = df[df['location'] == country]
    for column in columns:
        plt.plot(selected_data['date'], selected_data[column], label=column.replace('_', ' ').title())
    plt.xlabel('Date')
    plt.ylabel('Count')
    plt.title(f'COVID-19 Data for {country}')
    plt.legend()
    plt.xticks(rotation=45)
    mplcursors.cursor(hover=True)
    plt.show()

# Create interactive output
out = widgets.interactive_output(plot_data, {'country': country_dropdown, 'columns': columns_checkbox})

# Display widgets and output
display(country_dropdown, columns_checkbox, out)
For reproducibility:
conda create -n sir_model_covid19 -y python=3.9
conda activate sir_model_covid19
conda install -y mamba
mamba install -y pandas matplotlib numpy scipy scikit-learn ipykernel notebook ipympl mplcursors
If you have any questions or suggestions, feel free to leave a comment below.



comments