Wasserstein distance and optimal transport
The Wasserstein metric or Wasserstein distance, also known as the Earth Mover’s Distance (EMD) or Optimal Transport Distance, is a powerful tool for quantifying the dissimilarity between two probability distributions. It finds applications in various fields, such as data science, machine learning, image processing, and information theory.

Motivation
Traditional distance metrics, such as Euclidean or Mean Squared Error (MSE), are widely used for comparing vectors or data points. However, when dealing with probability distributions, these metrics may not capture the underlying structures and dissimilarity effectively. The Wasserstein metric addresses this limitation by considering the transportation cost required to transform one distribution into another.
The Wasserstein metric measures the “work” necessary to transform one distribution into another, by solving the so-called optimal transport problem. The metric calculates the minimum cost of transporting mass from one distribution to another, where each element in the distributions represents a unit of mass. It finds an optimal transport plan that minimizes the cost of moving mass, resulting in a joint distribution. This joint distribution indicates the amount of mass to be moved from each element in the first to the corresponding element in the second distribution. The calculated Wasserstein distance represents the total cost required to transform one distribution into another. The lower the distance, the more similar the distributions, while a larger distance indicates higher dissimilarity.
The Wasserstein metric offers several advantages over traditional metrics:
- Robustness to distributional differences: It captures structural differences between distributions, making it more robust to changes in data distributions.
- Interpretability: The joint distribution obtained in the calculation provides insights into how mass is transported between distributions, aiding in understanding data relationships.
- Machine learning: Wasserstein distance finds applications in generative models, like Generative Adversarial Networks (GANs), for measuring the similarity between real and generated data distributions.
Mathematical foundation
The Wasserstein metric $W_p$ is a family of metrics that generalizes the Wasserstein distance for different values of the parameter $p$. Each $W_p$ distance is associated with a specific value of $p$ and measures the cost of transforming one probability distribution into another.
Mathematically, the $W_p$ distance between two probability distributions $P$ and $Q$ defined on a metric space $X$ is given by:
\[W_p(P, Q) = \left( \inf_{\gamma \in \Gamma} \int_{X \times X} d(x, y)^p \, d\gamma(x, y) \right)^{\frac{1}{p} }\]where
- $d(x, y)$ is a metric (distance function) defined on $X$, which measures the distance between elements $x$ and (y) in the metric space. This metric can, for example, be the Euclidean distance, the Minkowski distance, or the Manhattan distance, among others, depending on the specific application and the nature of the data.
- $\Gamma$ represents the set of joint probability distributions on $X \times X$ with marginals $P$ and $Q$. That is, $\gamma \in \Gamma$ satisfies $\gamma(A \times X) = P(A)$ and $\gamma(X \times B) = Q(B)$ for all measurable sets $A$ and $B$ in $X$.
- The infimum (minimum) is taken over all possible joint distributions $\gamma$ with prescribed marginals $P$ and $Q$.
- The parameter $p$ controls the order of the distance metric, with $p = 1$ corresponding to the Wasserstein-1 distance, $W_1$, and $p = 2$ corresponding to the Wasserstein-2 distance, $W_2$.
For the case of $p = 1$, the Wasserstein-$p$ distance becomes the Wasserstein-1 distance,
\[W_1(P, Q) = \inf_{\gamma \in \Gamma} \int_{X \times X} d(x, y) \, d\gamma(x, y).\]which measures the minimum cost of transporting mass from distribution $P$ to distribution $Q$ over the entire metric space $X$. The infimum is taken over all possible joint probability distributions $\gamma$ with marginals $P$ and $Q$.
For the case of $p = 2$, the Wasserstein-$p$ distance becomes:
\[W_2^2(P, Q) = \inf_{\gamma \in \Gamma(P, Q)} \int_{\mathcal{X} \times \mathcal{Y}} d(x, y)^2 \, d\gamma(x, y)\]This formulation represents the Wasserstein-2 distance squared, often used in practice.
The distance metric can be further rewritten as $d(x, y) = c(x, y)^p$. For the Wasserstein-1 distance , $p = 1$, thus
\[\begin{align*} W_1(P, Q) &= \inf_{\gamma \in \Gamma} \int_{X \times X} c(x, y)^1 \, d\gamma(x, y)\\ & = \inf_{\gamma \in \Gamma} \sum_{i,j} \gamma_{i,j} \cdot c_{i,j} \end{align*}\]In the last step, we have rewritten the integral as a sum over discrete elements in the metric space $X$. $\gamma_{i,j}$ is the mass transported from element $i$ in $P$ to element $j$ in $Q$, and $c_{i,j}$ is the cost of transportation from $i$ to $j$ (i.e., the distance between the elements). Note, that the sum is taken over all pairs of elements in the metric space. The two formulations of $W_1$ are equivalent. The Wasserstein-1 distance can be expressed either as an integral over the distance metric or as an infimum over joint probability distributions with a sum over the transportation costs. Both formulations capture the same fundamental concept of quantifying the transportation cost between two distributions.
The same accounts for the Wasserstein-2 distance, $W_2^2$. The distance metric is $d(x, y) = c(x, y)^2$, thus
\[\begin{align*} W_2^2(P, Q) &= \inf_{\gamma \in \Gamma(P, Q)} \int_{X \times X} c(x, y)^2 \, d\gamma(x, y)\\ &=\inf_{\gamma \in \Gamma(P, Q)} \sum_{i,j} \gamma_{i,j} \cdot c_{i,j}^2 \end{align*}\]We can also square the entire expression inside the infimum without changing the value of the optimization problem:
\[W_2^2(P, Q) = \left(\inf_{\gamma \in \Gamma(P, Q)} \sum_{i,j} \gamma_{i,j} \cdot c_{i,j}\right)^2\]Optimal transport problem
To summarize so far, the Wasserstein distance $W(P, Q)$ can be defined as the minimum cost of transporting the mass from distribution $P$ to $Q$. This transportation of mass is represented by a transport plan $\Gamma$, often also denoted as $T$, which is a non-negative matrix of size $n \times n$. $n$ is the number of samples in each distribution. Remember, $\Gamma = (\gamma_{ij})$, where $\gamma_{ij}$ represents the amount of mass to be transported from the $i$-th element of $P$ to the $j$-th element of $Q$. Therefors, in order to calculate the Wasserstein distance, we first need to find the optimal transport plan $\Gamma$ that minimizes the transportation cost, which is an optimization problem, while satisfying the constraints of mass conservation.
Let $P = {p_i}$ and $Q = {q_j}$ be discrete probability distributions defined on a discrete set of points $X$ and $Y$ respectively, where $p_i$ and $q_j$ represent the probability mass at points $x_i$ in $X$ and $y_j$ in $Y$ respectively. Let $C$ be again the cost matrix, where $C_{ij}$ represents the transportation cost from point $x_i$ to point $y_j$. The optimal transport plan is represented as a matrix $G$, where $G_{ij}$ represents the amount of mass to be transported from $x_i$ to $y_j$. The problem can be mathematically formulated as a linear programming problem, where the objective is to minimize the total transportation cost:
\[\text{Minimize} \quad \sum_{i,j} C_{ij} \cdot G_{ij}\]For each $i$ in $X$, the total amount of mass transported from $x_i$ to all points in $Y$ should be equal to $p_i$:
\[\sum_j G_{ij} = p_i \quad \forall i\]For each $j$ in $Y$, the total amount of mass transported to $y_j$ from all points in $X$ should be equal to $q_j$:
\[\sum_i G_{ij} = q_j \quad \forall j\]The amount of mass transported $G_{ij}$ should be non-negative:
\[G_{ij} \geq 0 \quad \forall i, j\]The above linear programming problem seeks to find the optimal transport plan $G$ that minimizes the total transportation cost $C_{ij} \cdot G_{ij}$ while satisfying the constraints of mass conservation.
Linear programming solvers can efficiently solve this problem and find the optimal transport plan. In Python, you can use various libraries to solve this transportation problem. One commonly used library is the POT (Python Optimal Transport)ꜛ library, which provides efficient implementations of optimal transport algorithms, including the linear programming-based algorithm and the Sinkhorn algorithm. If you want to see, how to implement a solver yourself, check out this blog postꜛ by Alex Williams, which provides a detailed explanation and example.
Once $\Gamma$ is found, the Wasserstein distance can be calculated as follows:
\[W(P, Q) = \sum_i \sum_j (G_{ij} * C_{ij})\]Below is a Python example of calculating the Wasserstein distance using the ot.emd() solver from the POT library. The code is adapted from the POT documentationꜛ, originally written by Mokhtar Z. Alaya:
import numpy as np
import matplotlib.pyplot as plt
import ot.plot
from ot.datasets import make_1D_gauss as gauss
from matplotlib import gridspec

# generate the distributions:
n = 100  # nb bins
x = np.arange(n, dtype=np.float64) # bin positions
a = gauss(n, m=20, s=5)  # m= mean, s= std
b = gauss(n, m=60, s=10)

# calculate the cost/loss matrix:
M = ot.dist(x.reshape((n, 1)), x.reshape((n, 1)), metric='sqeuclidean')
M /= M.max()

# solve transport plan problem:
G = ot.emd(a, b, M)

# calculate the Wasserstein distance:
w_dist = np.sum(G * M)
print(f"Wasserstein distance W_1: {w_dist}")

# plot distribution:
plt.figure(1, figsize=(6.4, 3))
plt.plot(x, a, c="#0072B2", label='Source distribution', lw=3)
plt.plot(x, b, c="#E69F00", label='Target distribution', lw=3)
ax = plt.gca()
ax.spines['top'].set_visible(False)
ax.spines['right'].set_visible(False)
ax.spines['left'].set_linewidth(2)
ax.spines['bottom'].set_linewidth(2)
ax.tick_params(axis='x', which='major', width=2)
ax.tick_params(axis='y', which='major', width=2)
ax.tick_params(axis='both', which='major', labelsize=12)
plt.legend()
plt.show()

# plot loss matrix:
plt.figure(2, figsize=(5, 5))
plot1D_mat(a, b, M, 'Cost matrix\nC$_{i,j}$')
plt.show()

# plot optimal transport plan:
plt.figure(3, figsize=(5, 5))
plot1D_mat(a, b, G, 'Optimal transport\nmatrix G$_{i,j}$')
plt.show()
The plot function plot1D_mat is a modified adaption from the POT library:
def plot1D_mat(a, b, M, title=''):
    """ Plot matrix :math:`\mathbf{M}`  with the source and target 1D distribution

    Creates a subplot with the source distribution :math:`\mathbf{a}` on the left and
    target distribution :math:`\mathbf{b}` on the top. The matrix :math:`\mathbf{M}` is shown in between.

    Modified function from the POT library.

    Parameters:
    ----------
    a : ndarray, shape (na,)
        Source distribution
    b : ndarray, shape (nb,)
        Target distribution
    M : ndarray, shape (na, nb)
        Matrix to plot
    """
    na, nb = M.shape
    gs = gridspec.GridSpec(3, 3)
    xa = np.arange(na)
    xb = np.arange(nb)

    ax1 = plt.subplot(gs[0, 1:])
    plt.plot(xb, b, c="#E69F00", label='Target\ndistribution', lw=2)
    ax1.spines['top'].set_visible(False)
    ax1.spines['right'].set_visible(False)
    plt.ylim((0, max(max(a), max(b))))
    # make axis thicker:
    ax1.spines['left'].set_linewidth(1.5)
    ax1.spines['bottom'].set_linewidth(1.5)
    plt.legend(fontsize=8)

    ax2 = plt.subplot(gs[1:, 0])
    plt.plot(a, xa, c="#0072B2",  label='Source\ndistribution', lw=2)
    plt.xlim((0, max(max(a), max(b))))
    plt.xticks(ax1.get_yticks())
    plt.gca().invert_xaxis()
    plt.gca().invert_yaxis()
    ax2.spines['top'].set_visible(False)
    ax2.spines['right'].set_visible(False)
    ax2.spines['left'].set_linewidth(1.5)
    ax2.spines['bottom'].set_linewidth(1.5)
    plt.legend(fontsize=8)

    plt.subplot(gs[1:, 1:], sharex=ax1, sharey=ax2)
    plt.imshow(M, interpolation='nearest', cmap="plasma")
    ax = plt.gca()
    plt.axis('off')
    plt.text(xa[-1:], 0.5, title, horizontalalignment='right', verticalalignment='top',
             color='white', fontsize=12, fontweight="bold")
    plt.xlim((0, nb))
    plt.tight_layout()
    plt.subplots_adjust(wspace=0., hspace=0.2)
Here is how the two distributions look like:
 Source and target distributions, $P$ and $Q$, respectively. The Wasserstein distance measures the minimum cost of transporting mass from the source distribution to the target distribution.
The cost matrix is calculated using the squared Euclidean distance metric between the elements of $P$ and $Q$:
 Cost matrix $C$ for the Wasserstein distance calculation. The cost matrix represents the cost of transporting mass from each element in the source distribution $P$ to each element in the target distribution $Q$. It is calculated using an appropriate distance metric (here: squared Euclidean) between the elements, normalized by dividing each element by the maximum value in the matrix.
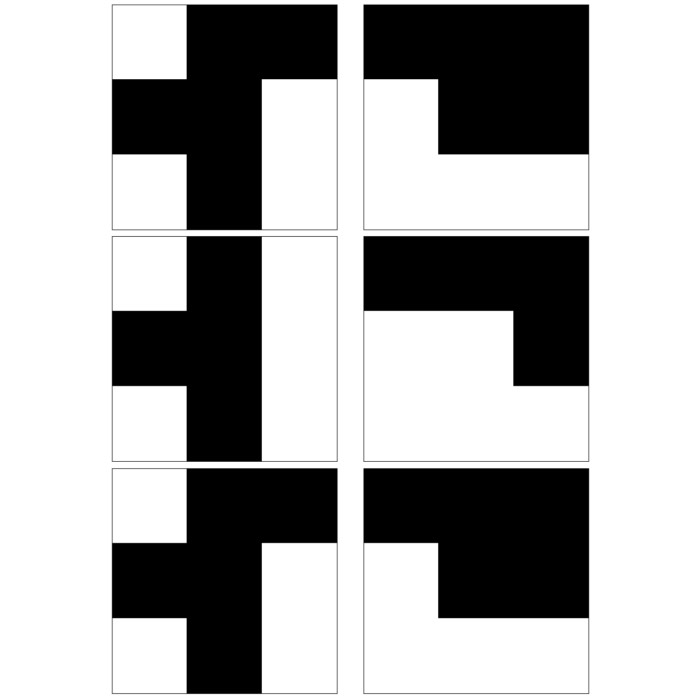
The optimal transport plan $G$ is a matrix, where each element represents the amount of mass to be transported from the corresponding element in the source distribution to the corresponding element in the target distribution. This matrix represents the optimal assignment of mass between the two distributions that minimizes the total transportation cost:
![]() Optimal transport plan $G$, which represents the amount of mass to be transported from each element in the source distribution $P$ to each element in the target distribution $Q$. The optimal transport plan is calculated by solving the linear programming problem, which minimizes the total transportation cost while satisfying the constraints of mass conservation.
Optimal transport plan $G$, which represents the amount of mass to be transported from each element in the source distribution $P$ to each element in the target distribution $Q$. The optimal transport plan is calculated by solving the linear programming problem, which minimizes the total transportation cost while satisfying the constraints of mass conservation.
The corresponding Wasserstein distance $W_1(P,Q)$ is:
Wasserstein distance W_1: 0.16580581101906636
The Wasserstein distance can be interpreted as the minimum cost, thus “work” of transforming the source distribution into the target distribution. Further more, it is a measure of dissimilarity between the two distributions. The lower the distance, the more similar the distributions, while a larger distance indicates higher dissimilarity.
The Wasserstein distance is not invariant to the order of the distributions. That is, $W_1(P, Q) \neq W_1(Q, P)$. This is because the transportation cost is not symmetric, i.e., the cost of transporting of mass from $P$ to $Q$ is not the same as the cost of transporting mass from $Q$ to $P$.
Choice of distance metric
The choice of distance metric significantly influences the Wasserstein metric. Different distance metrics can lead to distinct Wasserstein distances between the same distributions, capturing various aspects of their dissimilarity or similarity.
 Cost matrix $C$ (left) calculated based on the Euclidean distance for the source and target distributions from above. Note, how that the resulting transportation plan $G$ (right) is different from the one calculated using the squared Euclidean distance. This is also reflected by the resulting Wasserstein distance of $\sim$0.40 vs. $\sim$0.17.
 Cost matrix calculated based on the dice Canberra distance. The corresponding Wasserstein distance is $\sim$0.49.
 Cost matrix calculated based on the Jaccard distance. The corresponding Wasserstein distance is $\sim$0.99.
The selection of an appropriate distance metric depends on the data characteristics and the specific information one aims to emphasize. The Wasserstein metric’s versatility in accommodating diverse distance metrics makes it a powerful tool for comparing and analyzing probability distributions in various fields, from image analysis to machine learning.
Measure of dissimilarity
Let’s take a look at how to interpret the Wasserstein metric as a measure of dissimilarity.
Consider two Gaussian distributions, $A$ (source) and $B$ (target) with means $\mu_1$ and $\mu_2$ and standard deviations $\sigma_1$ and $\sigma_2$, respectively. The following Python code generates the two distributions and calculates their Wasserstein distance:
n=1000
x=np.linspace(-10, 10, n)

# define Gaussian function:
def my_gauss(x, m, s):
    return np.exp(-((x - m) ** 2) / (2 * s ** 2)) / (s * np.sqrt(2 * np.pi))

# define distribution plot function:
def plot_distributions(x, a, b, a_label="source distribution",
                      b_label="target distribution", title=""):
    plt.figure(1, figsize=(6.4, 3))
    plt.plot(x, a, c="#0072B2", label=a_label, lw=3)
    plt.plot(x, b, c="#E69F00", label=b_label, lw=3, ls='--')
    ax = plt.gca()
    ax.spines['top'].set_visible(False)
    ax.spines['right'].set_visible(False)
    ax.spines['left'].set_linewidth(2)
    ax.spines['bottom'].set_linewidth(2)
    ax.tick_params(axis='x', which='major', width=2)
    ax.tick_params(axis='y', which='major', width=2)
    ax.tick_params(axis='both', which='major', labelsize=12)
    plt.legend()
    plt.title(title)
    plt.tight_layout()
    plt.savefig('wasserstein_distributions.png', dpi=200)
    plt.show()

# define main executable function:
def calc_and_plot_distributions(x, m1=1, m2=1, s1=1, s2=1):
    a = my_gauss(x, m=m1, s=s1)
    b = my_gauss(x, m=m2, s=s2)
    a_label = f"source ($\mu$={m1}, $\sigma$={s1})"
    b_label = f"target ($\mu$={m2}, $\sigma$={s2})"
    w_dist = wasserstein_distance(a, b)
    plot_distributions(x, a, b, a_label, b_label, title=f"Wasserstein distance: {w_dist}")

calc_and_plot_distributions(x, m1=0, m2=0, s1=1, s2=1)
For the case that both distributions are identical, the Wasserstein distance is zero:
 Two Gaussian distributions with identical means and standard deviations. The Wasserstein distance is zero, as the distributions are identical.
As soon as we start to shift the target distribution along the $x$-axis, the Wasserstein distance increases. However, this increase is still relatively small, as the distributions are still very similar:
calc_and_plot_distributions(x, m1=0, m2=1, s1=1, s2=1)
calc_and_plot_distributions(x, m1=0, m2=5, s1=1, s2=1)

 Two Gaussian distributions with identical standard deviations, but different means. The Wasserstein distance increases as the target distribution is shifted along the $x$-axis.
The increase of the standard deviation of the target distribution leads to a larger Wasserstein distance, as the distributions become more dissimilar, while the movement along the $x$-axis still has just smaller effect:
calc_and_plot_distributions(x, m1=0, m2=0, s1=1, s2=2)
calc_and_plot_distributions(x, m1=0, m2=0, s1=1, s2=3)
calc_and_plot_distributions(x, m1=0, m2=2, s1=1, s2=3)


 Two Gaussian distributions with different standard deviations. The Wasserstein distance increases as the standard deviation of the target distribution increases (upper two panels). A shift along the $x$-axis still has just a smaller effect (lower panel).
Let’s change the target distribution to a double Gaussian distribution with two peaks:
def calc_and_plot_distributions2(x, m1=1, m2=1, m3=1, s1=1, s2=1, s3=1):
    a = my_gauss(x, m=m1, s=s1)
    b = my_gauss_mixt(x, m1=m2, m2=m3, s1=s2, s2=s3)
    a_label = f"source ($\mu$={m1}, $\sigma$={s1})"
    b_label = f"target ($\mu_1$={m2}, $\sigma_1$={s2} & $\mu_2$={m3}, $\sigma_2$={s3})"
    w_dist = wasserstein_distance(a, b)
    plot_distributions(x, a, b, a_label, b_label, title=f"Wasserstein distance: {w_dist}")

calc_and_plot_distributions2(x, m1=1, m2=-1, m3=3, s1=1, s2=1, s3=1)
The Wasserstein distance between a single normal Gaussian with $\mu_1=0$, $\sigma_1=1$ and a double peaked Gaussian with $\mu_2=-2$, $\mu_3=2$, $\sigma_2=\sigma_3=1$, respectively, is the same as for two single Gaussian distributions with $\mu_1=\mu_2=0$, $\sigma_1=1$ and $\sigma_2=2$ respectively (see plot above):
 Two different Gaussian distributions. The source distribution is still a single Gaussian distribution, while the target distribution is a double Gaussian distribution with two peaks.
The reason for is that we have created the two-peaked distribution by adding two normal distributions, while still keeping the resulting distribution normalized (the area under the curve is 1). The dissimilarity expressed by Wasserstein distance is the same for both cases. And this is independent of how far the two peaks are apart from each other or how far the barycenter of the two peaks is apart from $\mu_1$:
calc_and_plot_distributions2(x, m1=0, m2=-2+2, m3=2+2, s1=1, s2=1, s3=1)
calc_and_plot_distributions2(x, m1=0, m2=-3, m3=4, s1=1, s2=1, s3=1)

 The same two different Gaussian distributions from above, with the two Gaussian peaks of the target distribution shifted further apart (upper panel) and the barycenter of the target distribution shifted further away from the source distribution (lower panel). The Wasserstein distance remains almost the same as in the previous case.
An explanation of the observed behavior will be given in the next section.
Discrete 2D distributions
So far, we have only considered 1D distributions. However, the Wasserstein metric can also be applied to 2D distributions, using the same approach as described above.
Let’s create two sets of 2D normally distributed datasets.
# generate some toy data:
n = 50  # nb samples
m1  = np.array([0, 0])
m2  = np.array([4, 4])
s_1 = 1
s_2 = 1
cov1 = np.array([[s_1, 0], [0, s_1]])
cov2 = np.array([[s_2, 0], [0, s_2]])
np.random.seed(0)
xs = ot.datasets.make_2D_samples_gauss(n, m1, cov1)
np.random.seed(0)
xt = ot.datasets.make_2D_samples_gauss(n, m2, cov2)
a, b = np.ones((n,)) / n, np.ones((n,)) / n  # uniform distribution on samples
For ease of illustration, the two distributions are identical (for both distributions, np.random.seed() is reset to zero), but allow separate means and standard deviations to be specified.
The Wasserstein distance between the two distributions can be calculated via:
# loss matrix:
M = np.sum((xs[:, np.newaxis, :] - xt[np.newaxis, :, :]) ** 2, axis=-1)
M /= M.max()
# transport plan:
G0 = ot.emd(a, b, M)
# Wasserstein distance:
w_dist = np.sum(G0 * M)
Let’s plot the results. In the plots, we make use of POT’s ot.plot.plot2D_samples_mat() function, which plots lines between the source and target samples with a color proportional to the value of the transportation plan matrix:
fig, ax = plt.subplots(1, 3, figsize=(10, 3.5))
# plot the distributions:
plt.subplot(1, 3, 1, aspect='equal')
ot.plot.plot2D_samples_mat(xs, xt, G0, c="lightsteelblue")
plt.plot(xs[:, 0], xs[:, 1], '+', label=f'Source (random normal,\n $\mu$={m1}, $\sigma$={s_1})')
plt.plot(xt[:, 0], xt[:, 1], 'x', label=f'Target (random normal,\n $\mu$={m2}, $\sigma$={s_2})')
plt.legend(loc=0, fontsize=8)
plt.xlabel('x')
plt.ylabel('y')
plt.tight_layout()
plt.xlim(-10, 10)
plt.ylim(-10, 10)
plt.title(f'Source and target distributions\nWasserstein distance: {w_dist}')

# plot the loss/cost matrix:
plt.subplot(1, 3, 2)
plt.imshow(M, cmap='plasma')
plt.xlabel("i")
plt.ylabel("j")
plt.title('Cost matrix C$_{i,j}$')

# plot the optimal transport plan:
plt.subplot(1, 3, 3)
plt.imshow(G0, cmap='plasma')
plt.xlabel("i")
plt.ylabel("j")
plt.title('Optimal transport matrix G$_{i,j}$')

plt.tight_layout()
plt.show()
Here are the results for different sets of two discrete 2D distributions. The sets differ in such a way, that the target distribution is differently shifted against the source distribution:


 Different sets of two 2D discrete random, but normally distributed datasets. The distributions are identical, but shifted apart from each other. The source distribution is centered at $\mu_1=(0,0)$. The target distribution is shifted from the source distribution by $0$ units ($\mu_2=(0,0)$, upper panel), $+2$ units ($\mu_2=(2,2)$, middle panel), and $+4$ units ($\mu_2=(4,4)$, lower panel) into $x$- and $y$-direction, respectively. The standard deviations for all distributions is $\sigma_1=\sigma_2=1$. The corresponding Wasserstein distance is 0, $\sim$0.15 and $\sim$0.31, respectively. Left panels show the two distributions, middle panels the cost matrix, and right panels the optimal transport plan.
Note, that the cost matrices change for the different settings of the means, while the transportation plans remain the same. This is because the two distributions are identical and the optimal transport plan is determined based on the marginal sums of the two distributions. The transport plan aims to minimize the total transportation cost while ensuring that the total mass is conserved for both distributions. When we shift the target distribution in the $x$- and $y$-directions, the individual distances between corresponding points in the two distributions may change, but the overall structure of the distributions remains the same. As a result, the marginal sums of the distributions remain unchanged.
The diagonal shape of the transportation plan matrix is also due to the fact that the two datasets are identical. The optimal transport plan assigns each point in the source dataset to its corresponding point in the target dataset with zero transportation cost. As a result, the transportation plan has non-zero elements only on the diagonal, indicating that each point is transported to itself with zero cost. And this does not change, regardless we shift the two distributions apart from each other.
The same accounts for changes in the standard deviations of the target distribution, which affects the spread and dispersion of the data points. But, as the global structure and mass of the distributions remain the same, the optimal transport plan will again not change. The transportation cost is still minimized based on the marginal sums of the distributions, which remain unaffected by changes in the standard deviation:
 Same as above, but with a larger standard deviation of the target distribution ($\sigma_2=3$, $\mu_2=(4,4)$). The transportation plan still remains the same, as the marginal sums of the distributions remain unchanged.
Conclusion
The Wasserstein metric provides a robust and insightful approach for comparing probability distributions. By considering transportation costs and optimal transportation plans, it captures dissimilarity effectively, making it a valuable tool in various fields, including machine learning, data science, and information theory. Understanding the Wasserstein metric opens up new possibilities for analyzing data and improving various applications that rely on measuring distributional differences.
The code used in this post is available in this GitHub repositoryꜛ.
If you have any questions or suggestions, feel free to leave a comment below or reach out to me on Mastodonꜛ.

Comments
Comment on this post by publicly replying to this Mastodon post using a Mastodon or other ActivityPub/Fediverse account.
Comments on this website are based on a Mastodon-powered comment system. Learn more about it here.
There are no known comments, yet. Be the first to write a reply.