Hodgkin-Huxley model
An important step beyond simplified neuronal models, like the previously discussed Integrate-and-Fire model or the FitzHugh-Nagumo model, is the Hodgkin-Huxley model. This model is based on the experimental data of Hodgkin and Huxley, who received the Nobel Prize in 1963 for their discoveries concerning the ionic mechanisms involved in excitation and inhibition in the peripheral and central regions of the nerve cell membrane. The model describes the dynamics of the membrane potential of a neuron by incorporating biophysiological properties instead of phenomenological descriptions. Thus, it is a cornerstone of computational neuroscience and has been used to study the dynamics of action potentials in neurons and the behavior of neural networks.
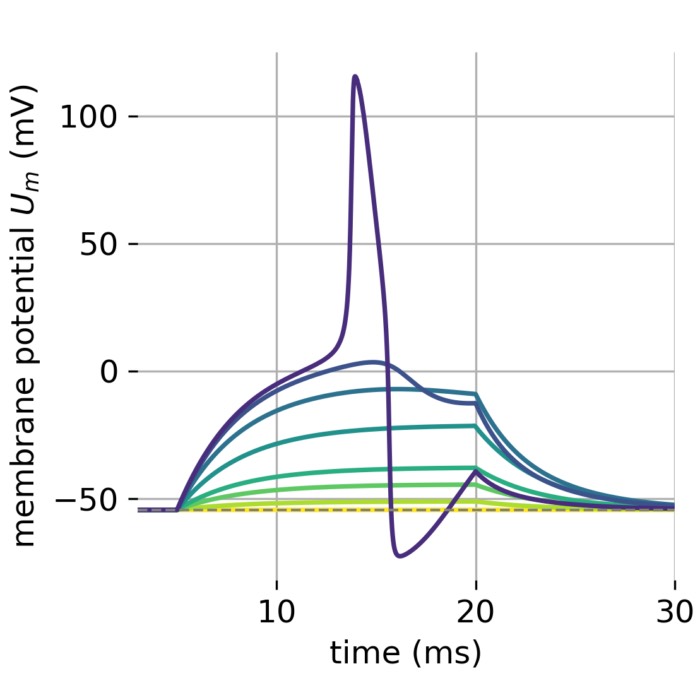 A set of membrane potentials modelled by the Hodgkin-Huxley model. Different currents were used to model the membrane potential.
Background and significance of the model
The model is named after the British physiologists Alan Lloyd Hodgkin and Andrew Fielding Huxley. Both scientists worked at the University of Cambridge and conducted their experiments on the giant axon of the squid. The Hodgkin-Huxley model was published in 1952ꜛ and is based on the voltage-clamp experiments they conducted in the 1940s. The model describes the dynamics of the membrane potential of a neuron and the flow of ions across the cell membrane. The model is based on the opening and closing of ion channels and the flow of sodium and potassium ions across the membrane. The model is a set of four coupled ordinary differential equations (ODE) that describe the dynamics of the membrane potential of a neuron.

Originally modelled action potential from Hodgkin & Huxley (1952)ꜛ.
Both scientists received the Nobel Prize in Physiology or Medicine in 1963 for their discoveries concerning the ionic mechanisms involved in excitation and inhibition in the peripheral and central regions of the nerve cell membrane. The Hodgkin-Huxley model enabled scientists for the first time to understand the dynamics of action potentials in neurons and the behavior of neural networks by using a mathematical framework, making it a cornerstone of computational neuroscience.

Detail of the cover of the 1963 Nobel Prize programme with Huxley on the left and Hodgkin on the right. On the front, you can see a lobster. However, Hodgkin and Huxley conducted most of their experiments on the squid, which has a large axon, making it easier to work with. The large diameter of the giant axon allowed them to insert electrodes inside the axon, enabling precise measurements of the ionic currents that underlie the action potential. Source: The Physiological Societyꜛ
Derivation of the model
In the following, we derive the Hodgkin-Huxley model step by step. We will first introduce the basic concepts of ion flows and the Nernst equation, followed by the membrane potential equation and the gating variables which comprise the model.
Ion flows and Nernst equation
When we discussed the Integrate-and-Fire model or the FitzHugh-Nagumo model, we actually neglected the role of ion flows across the cell membrane in the generation of action potentials. Indeed, ion flows across the cell membrane play a crucial role in the generation of action potentials in neurons. They are responsible for the changes in the membrane potential $U_{m}$ that lead to the generation of action potentials. Biologically, cell membranes consist of a lipid bilayer that separates the intracellular and extracellular compartments of the cell. The lipid bilayer is impermeable to ions. However, ion transport is facilitated by specific proteins that act as gates through the membrane: ion channels and ion pumps. Ion channels allow ions to flow passively across the membrane and are selective for specific ions, with their activity regulated by voltage, i.e., the membrane potential. In contrast, ion pumps actively transport ions across the membrane, establishing concentration gradients. For example, inside mammalian neurons, sodium ions are less concentrated ($\sim 10$ mM) compared to the outside ($\sim 145$ mM), while potassium ions are more concentrated inside ($\sim 140$ mM) than outside ($\sim 5$ mM). This imbalance is crucial for neuron function.

Schematic of an ion channel (left) along with carrier proteins (remaining structures) in the cell membrane. Ion channels are proteins that allow ions to flow across the cell membrane. They are selective for specific ions and can be regulated by voltage. Source: Wikimedia Commonsꜛ (license: public domain)
 Schematic of a sodium-potassium ion-pump. Ion pumps actively transport ions across the cell membrane, establishing concentration gradients. The ion pump uses energy derived from ATP to exchange sodium for potassium ions across the membrane. Source: Wikimedia Commonsꜛ (license: public domain)
Let’s recall that the membrane potential $U_{m}$ is defined as the voltage difference between the intra- and extracellular compartments of the cell, measured at the cell membrane,
\[U_{m} = U_{m} = U_{in} - U_{out}.\]
Cartoon demonstrating the generation of the membrane potential. Blue pentagons represent sodium ions, with a higher concentration outside the cell, and purple squares symbolize potassium ions, more abundant inside. Yellow circles and orange rectangles depict chloride ions and membrane-impermeable anions, respectively, highlighting the attraction of potassium ions to the latter. The large purple structure illustrates a potassium channel, with a black arrow indicating potassium’s net flow direction. Source: Wikimedia Commonsꜛ (license: CC0 1.0; modified)
The cartoon above demonstrates that differences in ion concentrations across the membrane, particularly potassium’s ($\text{K}$) higher internal concentration and sodium’s ($\text{Na}$) external dominance, contribute to establishing the membrane potential $U_m$. Typically, membrane potentials vary from $-70$ mV to $-40$ mV, with potassium ions being a primary driver due to their outward diffusion, leaving behind negative charges and creating charge separation. While potassium’s role is emphasized for its major contribution to $U_m$, sodium, chloride ($\text{Cl}$), calcium ($\text{Ca}$), and other ions also affect the membrane potential.
When each ion type’s electrochemical gradient is balanced, the ions have reached their equilibrium potential $U_\text{eq,ion}$, ceasing net movement. This equilibrium potential is determined by the Nernst equation, given by
\[\begin{align} U_\text{eq,ion}&={k_B\,T\over q}\, \ln \left({n_{out}\over n_{in}}\right), \label{eq:nernst} \end{align}\]where $U_\text{eq,ion}$ is the equilibrium potential of the ion, $k_B$ is the Boltzmann constant, $T$ is the temperature, $q$ is the charge of the ion, and $n_{out}$ and $n_{in}$ are the concentrations of the ion outside and inside the cell, respectively. $U_\text{eq,ion}$ is typically measured with the inside of the cell as the reference point, relative to the outside (which is conventionally set as 0 mV). For sodium, for instance, the equilibrium potential $U_\text{eq, Na}$ is around $+67$ mV, thus, there are more sodium ions outside the cell than inside (which turns the logarithm in Eq. ($\ref{eq:nernst}$) positive). At this potential, the electrochemical driving force for sodium ions into the cell balances with the force driving them out, given the ion’s higher concentration outside the cell. The equilibrium potential of potassium $U_\text{eq, K}$ is around $-85$ mV, analogously indicating the opposite.
If the membrane potential $U_{m}$ becomes lower than $U_\text{eq, Na}$, $\text{Na}^+$ ions flow into the cell via ion channels in order to reduce the difference of the sodium concentration between the intra- and extracellular compartments. This flow leads to a depolarization of the membrane, i.e., the membrane potential becomes more positive. If $U_{m}$ is higher than $U_\text{eq, Na}$, $\text{Na}^+$ ions flow out of the cell, leading to a hyperpolarization of the membrane. Thus, the direction of the ion flow is reversed when the membrane potential reaches the equilibrium potential, which is why the equilibrium potential is often also called the reversal potential.
Neurons are influenced by multiple ion types simultaneously, contributing to the overall membrane potential. The resting potential $u_{\rm rest}$ of a neuron, which is around $-65$ mV, is a balanced state where the outflow of potassium is matched by the inflow of sodium ions (since $U_{eq, K}\lt u_{\rm rest}\lt U_{eq, Na}$), maintained actively by ion pumps. In resting state, no action potentials are generated.
Membrane potential equation
The membrane potential equation integrates the effects of all ion flows through the cell membrane, accounting for the passive movement of ions through channels and the active transport by ion pumps. We could think of the neuron’s membrane as an electrical circuit, where the lipid bilayer acts as a capacitor $C$ storing charge (thus, reflecting the membrane’s ability to hold ions on either side, contributing to the membrane potential’s temporal dynamics), and the ion channels and pumps serve as variable resistors $R_{ion} = 1/g_{ion}$, controlling the flow of electrical current. $g_{ion}$ is the conductance of the ion channel.

RC diagram as an analogy for the membrane potential. The membrane acts as a capacitor $C$ storing charge, and the ion channels and pumps act as variable resistors $R_{ion}$ controlling the flow of electrical current. Source: Wikimedia Commonsꜛ (license: public domain; modified)
The relationship between current $I_{ion}$, voltage $U_{m}$, and the equilibrium potential $U_{eq,ion}$ is given by Ohm’s law,
\[\begin{align} I_{ion} &= g_{ion} (U_{m} - U_{eq,ion}), \end{align}\]where $(U_{m} - U_{eq,ion})$ can be considered as the driving force for the ion flow. The overall externally applied current $I_{ext}(t)$ splits into the current at the capacitor, $I_{C} = C \frac{dU_{m}}{dt}$, and the sum of the currents through the ion channels, $\sum_{ion} I_{ion}$,
\[\begin{align} I_{ext}(t) & = I_{C} + \sum_{ion} I_{ion} \\ \Leftrightarrow \; C \frac{dU_{m}}{dt} &= I_{ext}(t) - \sum_{ion} I_{ion}. \label{eq:membrane_potential} \end{align}\]The last transformation is the membrane potential equation and the first ODE of the Hodgkin-Huxley model. It describes the dynamics of the membrane potential $U_{m}$ over time $t$. The sum of the currents through the ion channels, $\sum_{ion} I_{ion}$, is the sum of the currents due to, e.g., sodium, potassium, and other leak ions (like chloride), $I_{Na}$, $I_{K}$, and $I_{L}$, respectively. Each of these currents is driven by the difference between the membrane potential and their respective equilibrium (or reversal) potentials, as described by the Nernst equation. The external current $I_{ext}(t)$ is any external current applied to the neuron, such as synaptic inputs or experimental stimulations.
Gating variables
The conductance of the ion channels, $g_{ion}$, is not constant but voltage and time dependent. For instance, when all channels are open, $g_{ion}$ is maximal. However, some of the channels are usually blocked. Hodgkin and Huxley measured how the channel conductance changes with time and voltage. They introduces so-called gating variables $m$, $h$, and $n$ for the sodium and potassium channel to describe their findings. The leak channel showed no voltage dependence and is constant:
\[\begin{align} \sum\nolimits_{ion} I_{ion} = & \quad g_{Na} m^3 h (U_{m} - U_{eq,Na}) \notag \\ & + g_{K} n^4 (U_{m} - U_{eq,K}) \\ & + g_{L} (U_{m} - U_{eq,L}), \notag \end{align}\]The gating variables describe the probability of the channels to be open at a given time. $m$ and $h$ control the sodium channel, while $n$ controls the potassium channel. $m$ controls the activation of the sodium channel, $h$ its inactivation, and $n$ the activation of the potassium channel. The gating variables are described by differential equations that depend on the membrane potential $U_{m}$:
\[\begin{align} \frac{dm}{dt} & = \alpha_{m}(U_{m}) (1 - m) - \beta_{m}(U_{m}) m, \label{eq:dm} \\ \frac{dh}{dt} & = \alpha_{h}(U_{m}) (1 - h) - \beta_{h}(U_{m}) h, \label{eq:dh} \\ \frac{dn}{dt} & = \alpha_{n}(U_{m}) (1 - n) - \beta_{n}(U_{m}) n. \label{eq:dn} \end{align}\]Equations ($\ref{eq:dm}$) to ($\ref{eq:dn}$) constitute the second set of ODEs of the Hodgkin-Huxley model.
The functions $\alpha_{p}(U_{m})$ and $\beta_{p}(U_{m})$ with $p \in \lbrace m, h, n\rbrace$ are voltage-dependent functions that describe the opening and closing of the ion channels. They are also called rate function and were experimentally determined by Hodgkin and Huxley. They can be expressed as functions of $U_m$ that typically involve exponential or sigmoidal terms, reflecting the voltage-sensitive opening and closing of ion channels. They are given by
\[\begin{align} \alpha_{p}(U_{m}) & = p_\infty(U_{m}) / \tau_{p}, \label{eq:alpha} \\ \beta_{p}(U_{m}) & = (1 - p_\infty(U_{m})) / \tau_{p}, \label{eq:beta} \end{align}\]where $p_\infty(U_{m})$ and $(1 - p_\infty(U_{m}))$ are the steady state values of the gating variable $p$ at voltage $U_{m}$ for activation and inactivation, respectively. $\tau_{p}$ is the time constant of the gating variable. The steady state values are usually defined by Boltzmann equations and have the general form:
\[\begin{align} \alpha_{p}(U_{m}) & = \frac{\theta_{p,1} (U_{m} - \theta_{p,2})}{\theta_{p,4} - \exp\left(\frac{\theta_{p,2}-U_{m}}{\theta_{p,3}}\right)}, \\ \beta_{p}(U_{m}) & = \theta_{p,5} \exp\left(-\frac{U_{m}}{\theta_{p,6}}\right). \end{align}\]with $\theta_{p,i}$ being the parameters of the Boltzmann equation. In their original work, Hodgkin and Huxley found the following values for the parameters $\theta_{p,i}$:
\[\begin{align*} \alpha_{m}(U_{m}) & = 0.1 \cdot \frac{25 - U_{m}}{\exp\left(\frac{25 - U_{m}}{10}\right) - 1}, \\ \beta_{m}(U_{m}) & = 4 \cdot \exp\left(-\frac{U_{m}}{18}\right) \end{align*}\]and
\[\begin{align*} \alpha_{h}(U_{m}) & = 0.07 \cdot \exp\left(-\frac{U_{m}}{20}\right), \\ \beta_{h}(U_{m}) & = \frac{1}{\exp\left(\frac{30 - U_{m}}{10}\right) + 1}, \end{align*}\]and
\[\begin{align*} \alpha_{n}(U_{m}) & = 0.01 \cdot \frac{10 - U_{m}}{\exp\left(\frac{10 - U_{m}}{10}\right) - 1}, \\ \beta_{n}(U_{m}) & = 0.125 \cdot \exp\left(-\frac{U_{m}}{80}\right). \end{align*}\]Summary
In total, the Hodgkin-Huxley model consists of a set of four coupled, non-linear ordinary differential equations: one for the membrane potential equation (Eq. ($\ref{eq:membrane_potential}$)) and three for the gating variables (Eq. ($\ref{eq:dm}$) to ($\ref{eq:dn}$)) associated with the sodium and potassium channels. We can express the latter equations even in a slightly more elegant form so that we finally have the following system of ODEs:
\[\begin{align} C \frac{dU_{m}}{dt} =& \; I_{ext}(t) \; - \notag \\ & - g_{Na} m^3 h (U_{m} - U_{eq,Na}) \notag \\ & - g_{K} n^4 (U_{m} - U_{eq,K}) \label{eq:hh1} \\ & - g_{L} (U_{m} - U_{eq,L}) \notag \\ \frac{dp}{dt} = & \; \alpha_{p}(U_{m}) (1 - p) - \beta_{p}(U_{m}) x, \label{eq:hh2} \end{align}\]with $\alpha_{p}(U_{m})$ and $\beta_{p}(U_{m})$ given by Equations ($\ref{eq:alpha}$) and ($\ref{eq:beta}$) and $p \in \lbrace m, h, n\rbrace$.
Equations ($\ref{eq:hh1}$) and ($\ref{eq:hh2}$) together provide a dynamic system that models the electrical behavior of neurons by describing how ion conductances change in response to membrane potential and how these changes affect the membrane potential over time. The huge advantage of this model over simpler models is that it can reproduce the dynamics of action potentials in neurons, depending on the actual physical properties of the ion channels. Unlike simplified models such as the previously discussed FitzHugh-Nagumo model, which often describe the action potential phenomenologically, the Hodgkin-Huxley model is based on the biophysical properties of the neuron and can therefore be used to study the dynamics of action potentials in neurons in more detail. Also, the model can be extended to include many other ion channel types, which proves the versatility of the model and its applicability to a broad variety of neurons.
The four ODEs cannot generally be solved analytically, but only by numerical approximation methods such as the Runge-Kutta method that will apply in our simulations below.
Units
The units of the variables in the Hodgkin-Huxley model are as follows:
| Variable | Unit | Description |
|---|---|---|
| $U_{m}$ | mV | Membrane potential |
| $I_{ext}$ | $\mu$A cm$^{-2}$ | External current |
| $C$ | $\mu$F | Membrane capacitance |
| $g_{Na}$ | mS cm$^{-2}$ | Sodium conductance |
| $g_{K}$ | mS cm$^{-2}$ | Potassium conductance |
| $g_{L}$ | mS cm$^{-2}$ | Leak conductance |
| $m, h, n$ | - | Gating variables |
| $U_{eq,Na}$ | mV | Sodium equilibrium potential |
| $U_{eq,K}$ | mV | Potassium equilibrium potential |
| $U_{eq,L}$ | mV | Leak equilibrium potential |
| $\alpha_{p}$ | ms$^{-1}$ | Rate function |
| $\beta_{p}$ | ms$^{-1}$ | Rate function |
| $\tau_{p}$ | ms | Time constant |
The normalization by cm$^2$ accounts for a (potential) scaling by the membrane area. The membrane potential change, $\Delta U_{m}$, due to ionic currents is influenced by the membrane’s capacitance, $C_m$, which in turn is proportional to the membrane area or patch ($A$). Thus, $C_m$ is typically given in units of capacitance per unit area ($\mu$F/cm$^2$). When we define current density, $I_{ion}$, in terms of $\mu$A/cm$^2$, we are essentially considering how much current flows per unit area of the neuron’s membrane. This approach ensures that the model’s output can be applied universally to different neurons regardless of their size by normalizing the effect of the current to an area.
Python code
In the following, we will go through the main parts of the Python code for simulating the Hodgkin-Huxley model. The entire code can be found in this Github repositoryꜛ.
Constants
We use the following constants for our simulations:
| Constant | Value | Description |
|---|---|---|
| $C_m$ | 1.0 $\mu$F/cm$^2$ | Membrane capacitance |
| $g_{Na}$ | 120.0 mS/cm$^2$ | Sodium conductance |
| $g_{K}$ | 36.0 mS/cm$^2$ | Potassium conductance |
| $g_{L}$ | 0.3 mS/cm$^2$ | Leak conductance |
| $U_{eq,Na}$ | 120 mV | Sodium equilibrium potential |
| $U_{eq,K}$ | -77.0 mV | Potassium equilibrium potential |
| $U_{eq,L}$ | -54.387 mV | Leak equilibrium potential |
Estimating the resting membrane potential
To calculate the resulting resting membrane potential ($U_{\text{rest}}$) from these constants, we need to consider the equilibrium condition where the net ionic current through the membrane is zero. At rest, the total current flowing across the membrane should equal zero, which means the sum of all ionic currents and any applied currents must cancel out. This calculation typically assumes no external stimulation ($I_{\text{ext}} = 0$):
\[I_{\text{Na}} + I_{\text{K}} + I_{\text{L}} = 0\]We assume that $m$, $h$, and $n$ are at their steady-state values at $U_{\text{m}} = U_{\text{rest}}$. However, because calculating this directly can be complex due to the nonlinear nature of the equations, we make a simplification and consider $m$ and $h$ for the sodium current as negligible if far from the threshold potential, simplifying the equation to mainly consider potassium and leak currents:
\[\begin{align*} I_{\text{K}} + I_{\text{L}} &= 0 \\ \Leftrightarrow \quad g_{\text{K}} n^4 (U_{\text{rest}} - U_{\text{eq,K}}) \; + & \\ + \; g_{\text{L}} (U_{\text{rest}} - U_{\text{eq,L}}) &= 0 \\ \Leftrightarrow \quad \frac{g_{\text{K}} n^4 U_{\text{eq,K}} + g_{\text{L}} U_{\text{eq,L}}}{g_{\text{K}} n^4 + g_{\text{L}}} &= U_{\text{rest}} \end{align*}\]To estimate $n^4$ at rest, we use $n_{\infty}$ (see next section) calculated at an assumed $U_{\text{rest}}$ like $-65$ mV:
def n_inf(U_m):
    alpha_n = 0.01 * (10 - U_m) / (np.exp((10 - U_m) / 10) - 1)
    beta_n = 0.125 * np.exp(-U_m / 80)
    return alpha_n / (alpha_n + beta_n)

# constants:
g_K = 36.0  # mS/cm^2
g_L = 0.3   # mS/cm^2
U_K = -77.0 # mV
U_L = -54.387 # mV

# assume an initial U_rest for calculating n_inf:
U_rest_guess = -65.0 # mV
n4 = n_inf(U_rest_guess)**4

# calculate U_rest:
U_rest = (g_K * n4 * U_K + g_L * U_L) / (g_K * n4 + g_L)
print(f"Estimated resting membrane potential U_rest:{U_rest} mv")
Estimated resting membrane potential U_rest:-54.387000012713244 mv
For more accuracy, you might consider an iterative approach where you adjust $U_{\text{rest}}$ based on recalculating $n_{\infty}$ until the changes in $U_{\text{rest}}$ are minimal between iterations.
Our chosen approach provides a close approximation of the resting membrane potential based on our model’s constants and is typically sufficient unless precise dynamics near the threshold are critical.
Estimating initial values for the gating variables
We want to have a good starting point for the gating variables at the resting membrane potential $U_{\text{rest}}$. This ensures that the starting conditions for the gating variables are consistent with the biophysical properties of the channels at the resting or initial membrane potential.
The steady-state (equilibrium) values $m_{\infty}$, $h_{\infty}$, and $n_{\infty}$ for the gating variables can be calculated using Equation ($\ref{eq:hh2}$):
\[\frac{dp}{dt} = \alpha_p(U_m) (1 - p) - \beta_x(U_m) p\]To find the steady-state values $p_{\infty}$, we set the time derivative of the gating variable to zero (assuming the system is in equilibrium and does not change): $\frac{dp}{dt} = 0$. Plugging this into the equation, we get:
\[\begin{align*} \alpha_p(U_m) (1 - p) - \beta_p(U_m) p &=0 \\ \Leftrightarrow \quad \alpha_p(U_m) (1 - p) &= \beta_p(U_m) p \\ \Leftrightarrow \quad \alpha_p(U_m) - \alpha_p(U_m) p &= \beta_p(U_m) p \\ \Leftrightarrow \quad \beta_p(U_m) p + \alpha_p(U_m) p &= \alpha_p(U_m) \\ \Leftrightarrow \quad \frac{\alpha_p(U_m)}{\alpha_p(U_m) + \beta_p(U_m)} &= p = p_\infty \end{align*}\]$p_{\infty}$ represents the equilibrium or steady-state proportion of channels that are in the open state (for $m$ and $n$) or not inactivated (for $h$) at a given membrane potential. At any given $U_m$, $p_{\infty}$ provides a snapshot of how receptive the channels are to opening (for $m$ and $n$) or how likely they are to be available (for $h$).
Next, we need to select a range of $U_m$ values around the resting membrane potential (e.g., from -100 mV to 100 mV) to calculate the steady-state values. The corresponding values at $U_m=U_{rest}$ will be our initial conditions for the gating variables, $m_0$, $h_0$, and $n_0$:
# define the range of membrane potentials:
U_m_range = np.linspace(-100, 100, 200)

# define alpha and beta functions for m, h, and n:
def alpha_m(U_m): return 0.1 * (25 - U_m) / (np.exp((25 - U_m) / 10) - 1)
def beta_m(U_m): return 4.0 * np.exp(-U_m / 18)
def alpha_h(U_m): return 0.07 * np.exp(-U_m / 20)
def beta_h(U_m): return 1 / (np.exp((30 - U_m) / 10) + 1)
def alpha_n(U_m): return 0.01 * (10 - U_m) / (np.exp((10 - U_m) / 10) - 1)
def beta_n(U_m): return 0.125 * np.exp(-U_m / 80)

# calculate the steady-state values for m, h, and n:
m_inf = [alpha_m(V) / (alpha_m(V) + beta_m(V)) for V in U_m_range]
h_inf = [alpha_h(V) / (alpha_h(V) + beta_h(V)) for V in U_m_range]
n_inf = [alpha_n(V) / (alpha_n(V) + beta_n(V)) for V in U_m_range]

# find indices where U_m is closest to U_rest mV:
U_find = U_rest
index_zero = np.argmin(np.abs(U_m_range - U_find))
print(f"At U_m = {U_find:.2f} mV, m_inf = {m_inf[index_zero]:.4f}, h_inf = {h_inf[index_zero]:.4f}, n_inf = {n_inf[index_zero]:.4f}")

# plotting:
plt.figure(figsize=(5.5, 5))
plt.plot(U_m_range, m_inf, label='$m_\infty(U_m)$', c='r')
plt.plot(U_m_range, h_inf, label='$h_\infty(U_m)$', c='g')
plt.plot(U_m_range, n_inf, label='$n_\infty(U_m)$', c='b')
plt.axvline(x=U_find, color='gray', linestyle='--', label=f'$U_m$={U_find:.2f} mV')
# indicate and annotate the steady-state values at U_m = 0 mV
plt.plot(U_find, m_inf[index_zero], 'ro')
plt.text(U_find, m_inf[index_zero], f' {m_inf[index_zero]:.2f}', verticalalignment='bottom',
         color='red')
plt.plot(U_find, h_inf[index_zero], 'go')
plt.text(U_find, h_inf[index_zero], f' {h_inf[index_zero]:.2f}', verticalalignment='bottom',
         color='green')
plt.plot(U_find, n_inf[index_zero], 'bo')
plt.text(U_find, n_inf[index_zero], f'{n_inf[index_zero]:.2f} ', verticalalignment='bottom',
         horizontalalignment='right', color='blue')
plt.title('Finding steady-state values of m, h, and n')
plt.xlabel('Membrane potential $U_m$ (mV)')
plt.ylabel('Steady-state value')
plt.legend()
plt.grid(True)
plt.show()
At U_m = -54.39 mV, m_inf = 0.0000, h_inf = 0.9998, n_inf = 0.0040

Estimating the steady-state values of the gating variables $m$, $h$, and $n$ at the resting membrane potential $U_{\text{rest}}$. The plot shows the steady-state values of the gating variables $m_{\infty}$ (red), $h_{\infty}$ (green), and $n_{\infty}$ (blue) as a function of the membrane potential $U_{m}$. The vertical dashed line indicates the resting membrane potential $U_{\text{rest}}$ at -54.387 mV (estimated in the previous section). Dots represent the corresponding steady-state values at $U_{\text{rest}}$ ($m_{\infty} = 0.0000$, $h_{\infty} = 0.9998$, and $n_{\infty} = 0.0040$).
Interpreting the results:
- $m_{\infty} = 0.0000$: This indicates that the activation gates of the sodium channels are nearly completely closed at this hyperpolarized potential. Sodium channels are mostly inactive because the membrane potential is far from the threshold needed to open these channels.
- $h_{\infty} = 0.9998$: This shows that the inactivation gates of the sodium channels are fully open, meaning the channels are ready to be activated if the membrane potential depolarizes to the threshold level. This is a protective mechanism ensuring that sodium channels can quickly activate if the neuron begins to depolarize.
- $n_{\infty} = 0.0040$: Reflects that only a very small fraction of the potassium channels’ activation gates are open at this membrane potential. However, since potassium channels play a significant role in maintaining the resting membrane potential, even a small proportion of open channels is significant.
When simulating the neuron with these values, starting from rest, the model accurately reflects the physiological state of the ion channels at rest, ensuring that any response to stimuli or changes in conditions is physiologically realistic.
Main simulation
import numpy as np
from scipy.integrate import solve_ivp
import matplotlib.pyplot as plt
import os

# constants:
C_m = 1.0  # membrane capacitance, in uF/cm^2
g_Na = 120.0  # maximum conductances, in mS/cm^2
g_K = 36.0
g_L = 0.3
U_Na = 120  # reversal potentials, in mV
U_K = -77.0
U_L = -54.387

# set initial conditions: V_m, m, h, n:
m0 = m_inf[index_zero]
h0 = h_inf[index_zero]
n0 = n_inf[index_zero]
y0 = [U_rest, m0, h0, n0]

# parameters for I_ext:
I_amp = 19   # amplitude of external current in uA/cm^2
intervals = [[5, 20]]

# time range:
t = np.linspace(0, 50, 5000)  # 50 milliseconds, 5000 points

# define the I_ext function to handle multiple intervals:
def I_ext(t, I_amp=1.0, intervals=[[5, 6], [10, 17]]):
    """ Return I_amp if t is within any of the specified intervals, else return 0. """
    for (start, end) in intervals:
        if start <= t <= end:
            return I_amp
    return 0

# Hodgkin-Huxley model differential equations:
def hodgkin_huxley(t, y, I_amp, intervals):
    V_m, m, h, n = y
    I_ext_current = I_ext(t, I_amp, intervals)
    dVmdt = (I_ext_current - g_Na * m**3 * h * (V_m - U_Na) - g_K * n**4 * (V_m - U_K) - g_L * (V_m - U_L)) / C_m
    alpha_m = 0.1 * (25 - V_m) / (np.exp((25 - V_m) / 10) - 1)
    beta_m = 4.0 * np.exp(-V_m / 18)
    alpha_h = 0.07 * np.exp(-V_m / 20)
    beta_h = 1 / (np.exp((30 - V_m) / 10) + 1)
    alpha_n = 0.01 * (10 - V_m) / (np.exp((10 - V_m) / 10) - 1)
    beta_n = 0.125 * np.exp(-V_m / 80)
    dmdt = alpha_m * (1 - m) - beta_m * m
    dhdt = alpha_h * (1 - h) - beta_h * h
    dndt = alpha_n * (1 - n) - beta_n * n
    return [dVmdt, dmdt, dhdt, dndt]

# solve ODE:
sol = solve_ivp(hodgkin_huxley, [t.min(), t.max()], y0, t_eval=t,
          args=(I_amp, intervals))

# plot results:
plt.figure(figsize=(7, 9.75))

# plotting membrane potential:
plt.subplot(4, 1, 1)
plt.plot(sol.t, sol.y[0], 'k', label='$U_m/t)$')
plt.ylabel('membrane potential\n$U_m$ (mV)')
plt.title(f"Membrane potential, gating variables, external current and phase plane plots")
# indicate U_rest:
plt.axhline(y=U_rest, color='gray', linestyle='--', label='$U_{rest}$')
plt.legend(loc='upper right')
plt.ylim(-100, 125)

# plotting gating variables:
plt.subplot(4, 1, 2)
plt.plot(sol.t, sol.y[1], 'r', label='$m$')
plt.plot(sol.t, sol.y[2], 'g', label='$h$')
plt.plot(sol.t, sol.y[3], 'b', label='$n$')
plt.ylabel('gating variables')
plt.legend(loc='upper right')
plt.xlabel('time (ms)')

# plotting external current:
plt.subplot(4, 1, 3)
plt.plot(sol.t, [I_ext(time, I_amp, intervals) for time in sol.t], label='$I_{ext}(t)$')
plt.ylabel('external current\n$I_{ext}$ ($\\mu A/cm^2$)')
plt.legend(loc='upper right')
plt.xlabel('time (ms)')

# plot U_m and m in phase space:
plt.subplot(4, 3, 10)
plt.plot(sol.y[0], sol.y[1], 'r', lw=1)
plt.plot(sol.y[0][0], sol.y[1][0], 'bo', label='start point', alpha=0.75, markersize=7)
plt.plot(sol.y[0][-1], sol.y[1][-1], 'o', c="yellow", label='end point', alpha=0.75, markersize=7)
plt.xlabel('$U_m$ (mV)')
plt.ylabel('$m$/$h$/$n$')
plt.ylim(-0.1, 1.1)

# plot U_m and h in phase space:
plt.subplot(4, 3, 11)
plt.plot(sol.y[0], sol.y[2], 'g', lw=1)
plt.plot(sol.y[0][0], sol.y[2][0], 'bo', label='start point', alpha=0.75, markersize=7)
plt.plot(sol.y[0][-1], sol.y[2][-1], 'o', c="yellow", label='end point', alpha=0.75, markersize=7)
plt.xlabel('$U_m$ (mV)')
plt.ylim(-0.1, 1.1)

# plot U_m and n in phase space:
plt.subplot(4, 3, 12)
plt.plot(sol.y[0], sol.y[3], 'b', lw=1)
plt.plot(sol.y[0][0], sol.y[3][0], 'bo', label='start', alpha=0.75, markersize=7)
plt.plot(sol.y[0][-1], sol.y[3][-1], 'o', c="yellow", label='end', alpha=0.75, markersize=7)
plt.xlabel('$U_m$ (mV)')
plt.ylim(-0.1, 1.1)
plt.legend(loc='upper right')

plt.tight_layout()
plt.show()
As input current, we define a Heaviside function with an adjustable amplitude I_amp that is applied for an adjustable set of time intervals:
with $n$ being the number of intervals and $t_{2k-1}$ and $t_{2k}$ the start and end times of the $k$-th interval.
Besides plotting the resulting membrane potential, gating variables, and external current, we also plot the phase plane trajectories of the membrane potential $U_m$ with the gating variables $m$, $h$, and $n$.
Threshold behavior
Let’s explore, at which minimum current an action potential can be triggered with our model. We will apply a step current of different amplitudes and observe the resulting membrane potential.

Membrane potential $U_m$ in response to different external currents $I_{\text{ext}}$ of varying amplitudes (0, 1, 3, 5, 10, 15, 18, and 19 $\mu$A/cm$^2$). The membrane potential is plotted over time in milliseconds. The action potential is triggered (roughly) at a minimum current of 19 $\mu$A/cm$^2$. The external current was injected for from 5 to 20 ms ($\Delta t$=15 ms).
The above study reveals, that with the given set of constants, our model fires an action potential (roughly) at a minimum current of 19 $\mu$A/cm$^2$. I.e., a certain threshold potential needs to be reached to trigger an action potential. This behavior mirrors a neuron’s physiological response to external stimuli as the threshold potential is an essential property of neurons, determined by the balance of the inward sodium current and the outward potassium current. A certain level of depolarization is required to initiate an action potential.
Simulating an action potential
Now, let’s further investigate, how the the ion channels’ gating variables $m$, $h$, and $n$ behave when the threshold potential is reached.
 Membrane potential $U_m$ and gating variables $m$, $h$, and $n$ in response to an external current of $I_{ext}=$ 19 $\mu$A/cm$^2$ applied for 14 ms. Phases of the action potential are indicated by shaded areas: depolarization (green), repolarization (orange), and hyperpolarization (purple). Additionally, the phase portraits of the membrane potential $U_m$ with the gating variables $m$, $h$, and $n$ are shown in the bottom panel. Start and end point of the phase plane trajectories are identical as the system starts and ends at rest.
In the plots above, we have applied an external current of 19 $\mu$A/cm$^2$ to trigger an action potential. The membrane potential $U_m$ shows the typical phases of an action potential: depolarization, repolarization, and hyperpolarization. The phase plane plots show, that the system converges to a limit cycle of one period. No further cycles and, thus, no further oscillations or action potentials were triggered as the current was stopped after 14 ms. And the gating variables reflect the physiological processes inside the cell during an action potential, as we will now discuss in more detail.
During the depolarization phase, the activation variable $m$ increases rapidly, while the inactivation variable $h$ decreases. This reflects the sodium channels opening and the sodium current flowing into the cell. The potassium activation variable $n$ also increases, but slower compared to $m$ since the potassium channels open more slowly.
The opening of the potassium channels leads to the subsequent repolarization phase as potassium ions start to flow out of the neuron, reversing the depolarization that occurred due to the influx of sodium ions. At the onset of the repolarization phase, the sodium activation variable $m$ reaches its maximum and then starts to decrease rapidly, while the inactivation variable $h$ increases, and both variables subsequently turn back towards their resting values after just a few milliseconds. This reflects the sodium channels closing and the sodium current decreasing quickly. The potassium activation variable $n$ keeps increasing and reaches its maximum at the end of the repolarization phase.
After its maximum, $n$ decreases, but much slower than $m$, thus potassium is still flowing out of the cell while no more sodium is flowing in. This leads to the hyperpolarization phase as the membrane potential becomes more negative than the normal resting potential. Hyperpolarization eventually diminishes as the membrane potential stabilizes back to the resting level, assisted by the closing of potassium channels and the restoration of sodium and potassium ion gradients by the sodium-potassium pump.
These dynamics ensure that the neuron does not remain in a permanently activated state and can respond to new stimuli appropriately. As previously described, the refractory period splits into the absolute refractory period and relative refractory period. The absolute refractory period spans the depolarization and part of the repolarization phase, during which the neuron cannot fire again, regardless of stimulus intensity. The relative refractory period follows during the hyperpolarization phase, requiring a stronger-than-usual stimulus to initiate another action potential. Together, these periods prevent the neuron from firing again too soon, ensuring that each signal is distinct and leads to controlled neural activity. The interplay of the gating variables and their corresponding ionic currents underpins the complex yet finely tuned process of neuronal firing. The changes in membrane potential and the activities of the ion channels are what make neural signaling possible, allowing for the transmission of information throughout the nervous system.
You may have noticed, that the applied current was turned off not before the end of the depolarization phase. If the current is turned off too early, for the set current amplitude, the threshold potential would not have been reached and no action potential is triggered. However, if we increase the current amplitude, the neuron will reach the threshold potential and fire an action potential, even for current durations shorter than the absolute refractory period:
 Membrane potential $U_m$ and gating variables $m$, $h$, and $n$ in response to a higher external current of $I_{ext}=$ 45 $\mu$A/cm$^2$ with a shorter time period of 3 ms compared to the previous simulation. The action potential is triggered even before the end of the depolarization phase.
The shorter, but now increased current pulse is able to trigger the action potential at an earlier time point than in the first simulation. Also, the dynamics of the action potential phases and the gating variables are accelerated.
Refractoriness
In the plots above, we applied an external current of 19 $\mu$A/cm$^2$ to trigger an action potential. If we introduce another short current pulse just 0.5 ms after the first, the system will not respond with a second action potential. This is due to the fact that the pulse was triggered still in the absolute refractory period, during which the sodium channels are inactivated and cannot be opened again (the gating variable $h$ is close to 0). The system needs to recover from this inactivation before it can fire another action potential.
 Membrane potential $U_m$ and gating variables $m$, $h$, and $n$ in response to two external current pulses of $I_{ext}=$ 45 $\mu$A/cm$^2$, each applied for 3 ms, being 0.5 ms apart. The second impulse is still in the absolute refractory period of the first action potential.
Injecting the second pulse right during the relative refractory period, we can see a response in the membrane potential. However, this is not an action potential but a subthreshold response or peak. Neither are all gating variables really responding nor a second limit cycle is established:
 Membrane potential $U_m$ and gating variables $m$, $h$, and $n$ in response to two external current pulses of $I_{ext}=$ 45 $\mu$A/cm$^2$, each applied for 3 ms, being 5 ms apart. The second impulse now lies in the relative refractory period of the first action potential.
However, if we increase the current amplitude further, the system will respond with a second action potential, even if the second pulse is still in the relative refractory period of the first action potential. This indicates that a higher stimulus can overcome the increased threshold of excitability during this phase:
 Membrane potential $U_m$ and gating variables $m$, $h$, and $n$ in response to two external current pulses, each applied for 3 ms, being 5 ms apart. The current amplitude is increased compared to the previous simulation ($I_{ext}=$ 75 $\mu$A/cm$^2$).
Triggering the second pulse outside the refractory period of the first action potential, the system will respond with a second action potential flawlessly:
 Membrane potential $U_m$ and gating variables $m$, $h$, and $n$ in response to two an external current pulses of $I_{ext}=$ 45 $\mu$A/cm$^2$, each applied for 3 ms, being 13 ms apart. The second impulse now lies outside the refractory period of the first action potential.
In summary, the Hodgkin-Huxley model accurately captures the refractory periods of neurons, reflecting their physiological behavior in response to external stimuli. As stated in the previous section, the refractory periods are essential for ensuring that neurons fire in a controlled manner and do not become overexcited. It is remarkable that the model is able to reproduce these complex physiological dynamics based on the interplay of the gating variables and the ionic currents.
Spike trains
Neurons often fire in patterns of action potentials, known as spike trains. These patterns can encode information and are crucial for neural communication. The Hodgkin-Huxley model can be used to simulate spike trains by applying different current pulses at specific intervals. Here, we will simulate a series of action potentials triggered both by an elongated constant external current pulse and a series of short external current pulses.
Constant current pulse
Let’s begin with the constant current pulse. We let simulation run a bit longer before to better observe the repetitive firing behavior of our model:
 Membrane potential $U_m$ and gating variables $m$, $h$, and $n$ in response to a constant external current pulse of $I_{ext}=$ 19 $\mu$A/cm$^2$ lasting for 95 ms. Only one action potential is triggered.
In the simulation above we have applied a constant current pulse of 19 $\mu$xA/cm$^2$ for 95 ms. The simulation triggers only one action potential. We already observed a similar behavior when we investigated the FitzHugh-Nagumo model. With the Hodgkin-Huxley model, we now have the opportunity to investigate the underlying mechanisms from a more physiological perspective.
The sudden increase of external current causes a rapid change in the gating variables and, thus, an opening and closing of the ion channels, which establishes dynamics for generating an action potential as described before. The membrane potential depolarizes rapidly, which is enough to surpass the threshold needed to open voltage-gated sodium channels.
However, after the first action potential, the gating variables do not return to their resting values due to the applied constant external current, which is, however, not sufficient to maintain the membrane potential above the threshold potential. The low current keeps the inactivation ($h$) of the sodium channel at a level that is neither fully inactivated nor fully recovered. This partial recovery of the inactivation variable $h$ prevents the system from firing another action potential, as the activation levels of both sodium ($m$) and potassium ($n$) channels do not reach the thresholds required for another action potential initiation. Even though $m$ may recover quickly enough to respond to continued depolarization, the sodium channels cannot fully activate because a significant portion remains inactivated. Concurrently, the potassium channels, governed by $n$, continue to facilitate the outward flow of potassium ions, which further stabilizes the membrane potential and counteracts depolarization induced by the external current.
The rapid depolarization of the membrane potential due to the abrupt increase in the external current occurs also for shorter current pulses, which was the reason why we could observe the generation of single action potentials in the previous section. We will further investigate this behavior in the subsequent section.
However, if we increase the current amplitude to, e.g. 25 $\mu$A/cm$^2$, the system responds with a series of action potentials:
 Membrane potential $U_m$ and gating variables $m$, $h$, and $n$ in response to a constant external current pulse of $I_{ext}=$ 25 $\mu$A/cm$^2$, again lasting for 95 ms. This time, a series of action potentials is triggered.
The applied current is now able to maintain the membrane potential above the threshold potential, allowing the system to fire a series of action potentials. The gating variables $m$, $h$, and $n$ show the typical dynamics of an action potential, with rapid changes in response to the external current. The system is now able to recover from the refractory period and fire multiple action potentials in response to the sustained depolarization. The potassium channels open and close in response to the membrane potential, allowing the neuron to repolarize and hyperpolarize between action potentials. The sodium channels also recover from inactivation, enabling the neuron to fire again. This behavior is consistent with the physiological response of neurons to external stimuli.
Furthermore, if we increase the current amplitude, e.g., to 50 $\mu$A/cm$^2$, the system responds with a higher firing rate:
 Same simulation as before, but with an increased current amplitude of $I_{ext}=$ 50 $\mu$A/cm$^2$. We can observer a higher firing rate.
To further investigate this behavior, we can run the model for a series of external currents and plot the resulting firing rate. To do so, we simulate the model for 500 ms and for different external current amplitudes (each lasting for 490 ms) and count the number of action potentials triggered. We then fit a sigmoid function to the data:
\[f(x) = \frac{L}{1 + e^{-k(x - x_0)}}\]where $L$ is the maximum number of action potentials, $k$ is the slope of the curve, and $x_0$ is the midpoint of the curve. This will allow us to better visualize the relationship between the external current and the firing rate:
from scipy.signal import argrelextrema
from scipy.optimize import curve_fit
I_amp_end = 200
intervals = [[5, 495]]
# time range:
t = np.linspace(0, 500, 5000)

# simulate the model for different external currents:
I_amps =[]
spike_counts = []
for I_amp in range(0, I_amp_end, 10):
    sol = solve_ivp(hodgkin_huxley, [t.min(), t.max()], y0, t_eval=t, args=(I_amp, intervals))
    idx_spikes = argrelextrema(sol.y[0], np.greater)[0]
    idx_spikes = [idx for idx in idx_spikes if sol.y[0][idx] > 0]
    I_amps.append(I_amp)
    spike_counts.append(len(idx_spikes))

# from I_amp=30 on, we fit a sigmoid function to the data:
def sigmoid(x, L, k, x0):
    return L / (1 + np.exp(-k * (x - x0)))
popt, pcov = curve_fit(sigmoid, I_amps[3:], spike_counts[3:], bounds=(0, [100., 0.1, 200]))

# generate enough x values to create a smooth plot:
x_values = np.linspace(0, 190, 400)
fitted_values = sigmoid(x_values, *popt)

# plot the frequency of the action potential as a function of the external current:
plt.figure(figsize=(5, 4))
plt.plot(I_amps, spike_counts, 'ko', lw=1.75, label='data points')
plt.plot(x_values, fitted_values, label='fitted sigmoid curve', color='red', lw=1.75)
plt.title(f"Firing rate vs. external current")
plt.xlabel('external current $I_{ext}$ ($\\mu A/cm^2$)')
plt.ylabel('number of spikes')
plt.grid(True)
plt.gca().spines['top'].set_visible(False)
plt.gca().spines['right'].set_visible(False)
plt.gca().spines['bottom'].set_visible(False)
plt.gca().spines['left'].set_visible(False)
plt.legend()
plt.tight_layout()
plt.show()

Firing rate calculated for different external current amplitudes. The number of action potentials triggered is plotted against the external current amplitude. A sigmoid function is fitted to the data points to visualize the relationship between the external current and the firing rate.
Indeed, the firing rate increases with the external current amplitude. However, the relationship is not linear but follows a sigmoid curve. Thus, it will become increasingly difficult to trigger additional action potentials as the external current amplitude increases.
Overall, this behavior is consistent with the physiological response of neurons to external stimuli. It highlights the neuron’s capability to encode the intensity and duration of stimuli into the frequency of action potentials, a fundamental feature of neural information processing known as frequency coding.
Pulsed current injection
To inject a series of current pulses, we modify the intervals variable in our code in such a way, that we gain control over the timing of the current pulses:
t_start = 5 # ms
t_stop = 150
t_duration = 15 # ms
t_off_time = 10 # ms
intervals = []
t = t_start
while t < t_stop:
    intervals.append([t, t + t_duration])
    t += t_duration + t_off_time
In the code above, we define a start time t_start, a stop time t_stop, a duration of the current pulse t_duration, and an off time t_off_time. We then create a list of intervals for the current pulses, starting at t_start and ending at t_stop, with each pulse lasting for t_duration ms and an off time of t_off_time ms between each pulse.
A pulse frequency of 15 ms with pulses lasting for 4 ms and an amplitude of 50 $\mu$A/cm$^2$ will trigger a moderate series of action potentials:

Membrane potential and gating variables for a pulsed external current. A pulse of 50 $\mu$A/cm$^2$ is applied for 4 ms every 15 ms.
Increasing the pulse frequency leads to a higher firing rate:

Membrane potential and gating variables for a pulsed external current. A pulse of 50 $\mu$A/cm$^2$ is applied for 4 ms every 10 ms.
Further increasing the pulse frequency and applying shorter pulses of 2 ms will lead to an even higher firing rate:

Membrane potential and gating variables for a pulsed external current. A pulse of 50 $\mu$A/cm$^2$ is applied for 2 ms every 10 ms.
Even more complex firing patterns are possible by setting the current pulse frequency appropriately and, e.g., increasing the current amplitude:

Membrane potential and gating variables for a pulsed external current. A pulse of 200 $\mu$A/cm$^2$ is applied for 15 ms every 10 ms.
One could further modify the external current function in such a way that it follows a more complex pattern, e.g., a sinusoidal function, to investigate the response of the model to more intricate stimuli. Implementing a variable current amplitude and pulse frequency would also allow for the simulation of more realistic scenarios. We omit this here for the sake of brevity, but feel free to further experiment with the given code.
In summary, the Hodgkin-Huxley model is able to simulate a broad range of different firing patterns, from simple to complex structured spike trains. Thus, the model can be used to investigate the response of neurons to various external stimuli and to study the underlying mechanisms of neural information processing.
Abrupt vs. ramped current injection
In our discussion of a constant current injection, we observed that the system could fire a single action potential when a low-amplitude current was applied but failed to trigger further action potentials. This behavior, also noted in the FitzHugh-Nagumo model, results from the abrupt increase in external current which causes rapid depolarization of the membrane potential (in the Hodgkin-Huxley model) or a rapid increase of the $v$ variable (in the FitzHugh-Nagumo model).
To investigate whether the Hodgkin-Huxley model responds differently to a non-abrupt, but ramped current injection, we will simulate the model for a ramped current pulse, similar to our experiments with the FitzHugh-Nagumo model. Here, we modify the external current definition in our code to gradually increase the current, allowing us to examine the neuronal response under different stimulation dynamics:
def I_ext_ramped(t, I_amp=10.0, t_ramp_start=5, t_ramp_end=10, t_off=20):
    if t < t_ramp_start or t > t_off:
        return 0
    elif t_ramp_start <= t <= t_ramp_end:
        return I_amp * (t - t_ramp_start) / (t_ramp_end - t_ramp_start)
    else:
        return I_amp

# redefine the Hodgkin-Huxley model to include the ramped external current:
def hodgkin_huxley_ramped(t, y, I_amp, t_ramp_start, t_ramp_end, t_off):
    V_m, m, h, n = y
    # exchange I_ext with I_ext_ramped:
    I_ext_current = I_ext_ramped(t, I_amp, t_ramp_start, t_ramp_end, t_off)
    dVmdt = (I_ext_current - g_Na * m**3 * h * (V_m - U_Na) - g_K * n**4 * (V_m - U_K) - g_L * (V_m - U_L)) / C_m
    # continue with the rest of the model as before:
    alpha_m = 0.1 * (25 - V_m) / (np.exp((25 - V_m) / 10) - 1)
    beta_m = 4.0 * np.exp(-V_m / 18)
    alpha_h = 0.07 * np.exp(-V_m / 20)
    beta_h = 1 / (np.exp((30 - V_m) / 10) + 1)
    alpha_n = 0.01 * (10 - V_m) / (np.exp((10 - V_m) / 10) - 1)
    beta_n = 0.125 * np.exp(-V_m / 80)
    dmdt = alpha_m * (1 - m) - beta_m * m
    dhdt = alpha_h * (1 - h) - beta_h * h
    dndt = alpha_n * (1 - n) - beta_n * n
    return [dVmdt, dmdt, dhdt, dndt]
The modified external current function I_ext_ramped smoothly increases the current from 0 to the desired amplitude I_amp between t_ramp_start and t_ramp_end, maintains it until t_off, and then drops to 0, mimicking a more physiologically realistic scenario where stimuli often increase gradually.
Let’s investigate the model with the modified external current function:

Membrane potential and gating variables for a ramped external current. The ramping starts at 5 ms and ends at 40 ms. The set current amplitude of 19 $\mu$A/cm$^2$ lasts until 100 ms.
Unlike the abrupt pulse scenario, the ramped current injection does not elicit an action potential, even though we apply the same current amplitude of 19 $\mu$A/cm$^2$. This result can be attributed to the slower rate of depolarization, which allows the gating variables, particularly $m$ and $h$, to adjust without rapidly exceeding the threshold potential. The gradual increase in current provides a smoother transition in membrane potential, preventing the sudden changes necessary for triggering an action potential. This reflects a critical aspect of neuronal excitability, where the rate of change in membrane potential can significantly influence the firing behavior. For instance, if we apply the same current amplitude but with a shorter ramping time, the system will respond with an action potential as if the current pulse was applied abruptly:

Membrane potential and gating variables for a ramped external current. The ramping starts at 5 ms and ends at 40 ms. The set current amplitude of 19 $\mu$A/cm$^2$ lasts until 100 ms.
This experiment underscores the nuanced role of current dynamics in neuronal firing and illustrates the complex interplay between external stimuli and neuronal response mechanisms. By modulating the rate of current application, we gain insights into how neurons might differentially process slowly developing versus sudden stimuli, a key consideration in natural neural function.
Conclusion
We have explored the Hodgkin-Huxley model, a fundamental model of neuronal excitability that describes the dynamics of action potentials in neurons. By simulating the model, we have gained insights into the complex interplay between ion channels, gating variables, and membrane potential that underlie the generation of action potentials. We have investigated the response of the model to different external stimuli, including constant and pulsed current injections, and examined the refractory periods of neurons. We have also explored the model’s ability to simulate spike trains and firing rate modulation, highlighting its utility in studying neural information processing.
The Hodgkin-Huxley model provides a powerful framework for understanding the biophysical mechanisms of neuronal excitability and the generation of action potentials. By capturing the intricate dynamics of ion channels and gating variables, the model offers a detailed and physiologically realistic description of neuronal behavior. Through simulations and analyses, we have demonstrated how the model can be used to investigate a wide range of neuronal responses to external stimuli and to study the underlying mechanisms of neural information processing.
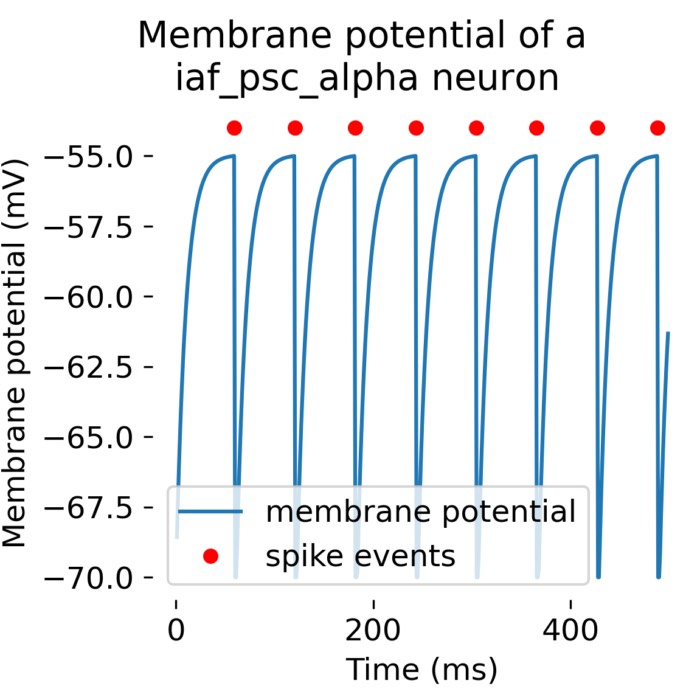
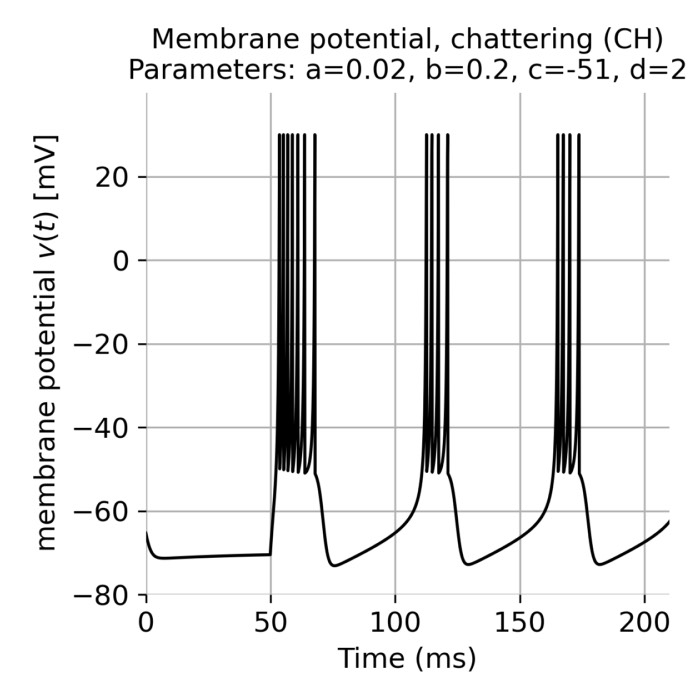
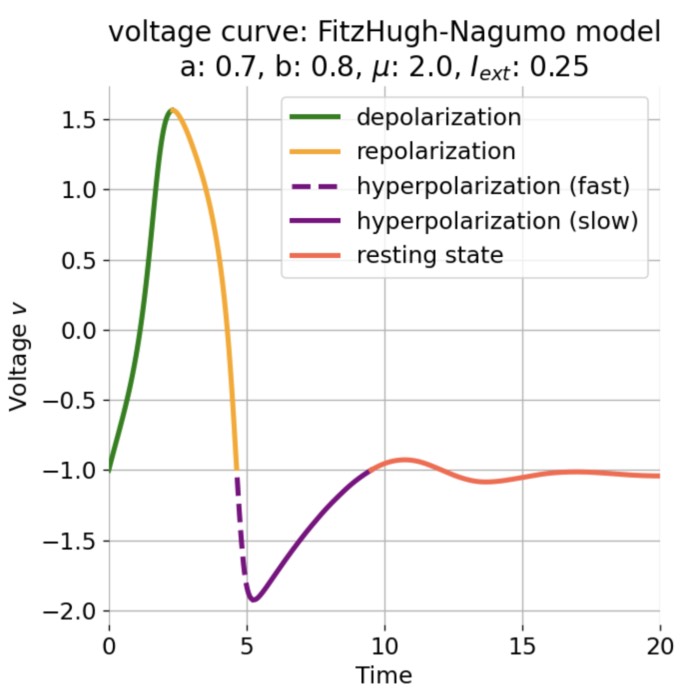
To gain further insights in the dynamics of the model, it is often simplified by reducing the number of variables and parameters. The discussed FitzHugh-Nagumo model is one such simplification. Other simplifications include the Morris-Lecar modelꜛ, the Izhikevich model, or the Integrate-and-Fire model. Each of these models captures different aspects of neuronal dynamics and can be used to study specific phenomena in neural systems.
The entire code used in this blog post is freely available in this Github repositoryꜛ. Feel free to experiment with the code, modify the parameters, and explore the dynamics of the Hodgkin-Huxley model further.
References and further reading
- Hodgkin, A. L., & Huxley, A. F., A quantitative description of membrane current and its application to conduction and excitation in nerve, 1952, The Journal of Physiology, 117(4), 500–544, doi: 10.1113/jphysiol.1952.sp004764ꜛ
- A. L. Hodgkin, The local electric changes associated with repetitive action in a non-medullated axon, 1948, The Journal of physiology, url, doi: 10.1113/jphysiol.1948.sp004260
- Wulfram Gerstner, Werner M. Kistler, Richard Naud, and Liam Paninski, Neuronal Dynamics: From Single Neurons to Networks and Models of Cognition. Chapter 2: Ion Channels and the Hodgkin-Huxley Model, 2014, Cambridge University Press, ISBN: 978-1-107-06083-8
- Izhikevich, Eugene M., (2010), Dynamical systems in neuroscience: The geometry of excitability and bursting (First MIT Press paperback edition), The MIT Press, ISBN: 978-0-262-51420-0
- Purves, D. (Hrsg.), Neuroscience (Sixth edition), 2018, Oxford University Press, ISBN: 978-1-60535-380-7


comments