Filament tracing
If you haven’t installed Napari, please do so before proceeding with this tutorial. If you just want to practice this tutorial, install the following minimal installation:
conda create -n napari_bioimage_analysis -y python=3.9 mamba
conda activate napari_bioimage_analysis
mamba install -y napari napari-assistant napari-filaments napari-filament-annotator
Introduction
Filament tracing, filament skeletonization or filament extraction, is a process that involves extracting the underlying skeleton or centerline of filamentous structures, such as fibers, blood vessels, neurons, or branching structures in images. The goal is to capture the essential connectivity and shape information of these structures. Filament tracing algorithms often utilize image processing techniques, such as edge detection, thinning, and skeletonization, to extract the central axis or skeleton of the filaments, which can be further utilized for analysis, quantification, or visualization purposes.
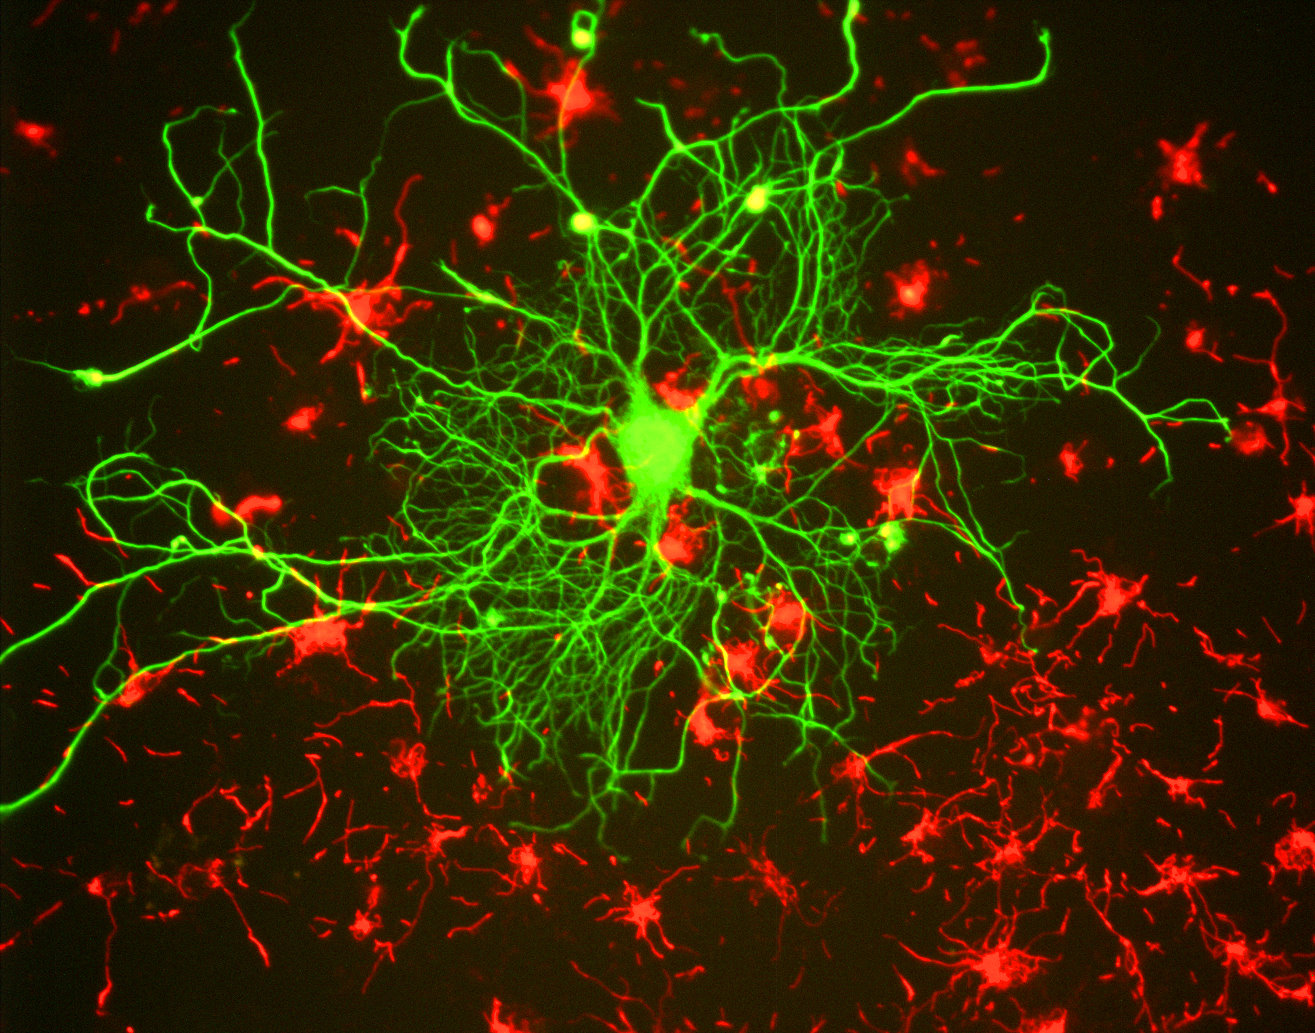 Neuron of a rat in tissue culture. Elongated and branching structures such as the ones of shown for this neuron are typical targets for filament tracing. Source: Wikimediaꜛ (CC BY-SA 3.0 license)
In Napari, two plugins enable the tracing of filaments. One is for 2D and one for 3D images. While both plugins aid the user in the tracing process, they do not provide a fully automated solution and the user still has to manually trace the filament in the image. However, both plugins provide some useful functions to make this process easier and more efficient.
2D filament tracing
To trace filaments in 2D images, we can use the Napari napari filaments pluginꜛ. To do so, follow these steps:
- Open the plugin’s widget via
Plugins->Open Filament Analyzer. - Choose
Layers->open imagefrom the widget to open a tif file. It is necessary to open the image via the widget, otherwise the plugin will not work. The opened image’s name will be displayed in thetarget imagesetting of the widget. The opening procedure will also automatically generate a new shape layer for annotating the filaments (target filaments). - Now, start redrawing the filaments one after another:
- Select the newly generated filaments shape layer and draw using the
Add pathtool. The number of currently selected shape (i.e., drawn filament) will be displayed in the widget’sfilamentbox. - After you’ve drawn a filament, let the plugin fit the shape to the actual filament in the image by pressing
F1or pressing theFit current spline to the image.button in the widget’sSplinetab. - You can cut, extend, re-fit, or delete filaments via the widget’s
Splinetab. - Repeat steps 1-3 until you’ve traced all filaments in the image.
- Select the newly generated filaments shape layer and draw using the
- When you’re done, switch to the widget’s
Measuretab and hitmeasure properties. This will generate a new table with the extracted length of each drawn and fit filament. This table can be saved for further analysis. - Choose
Layers->save filamentsto save and reopen the drawn filaments.
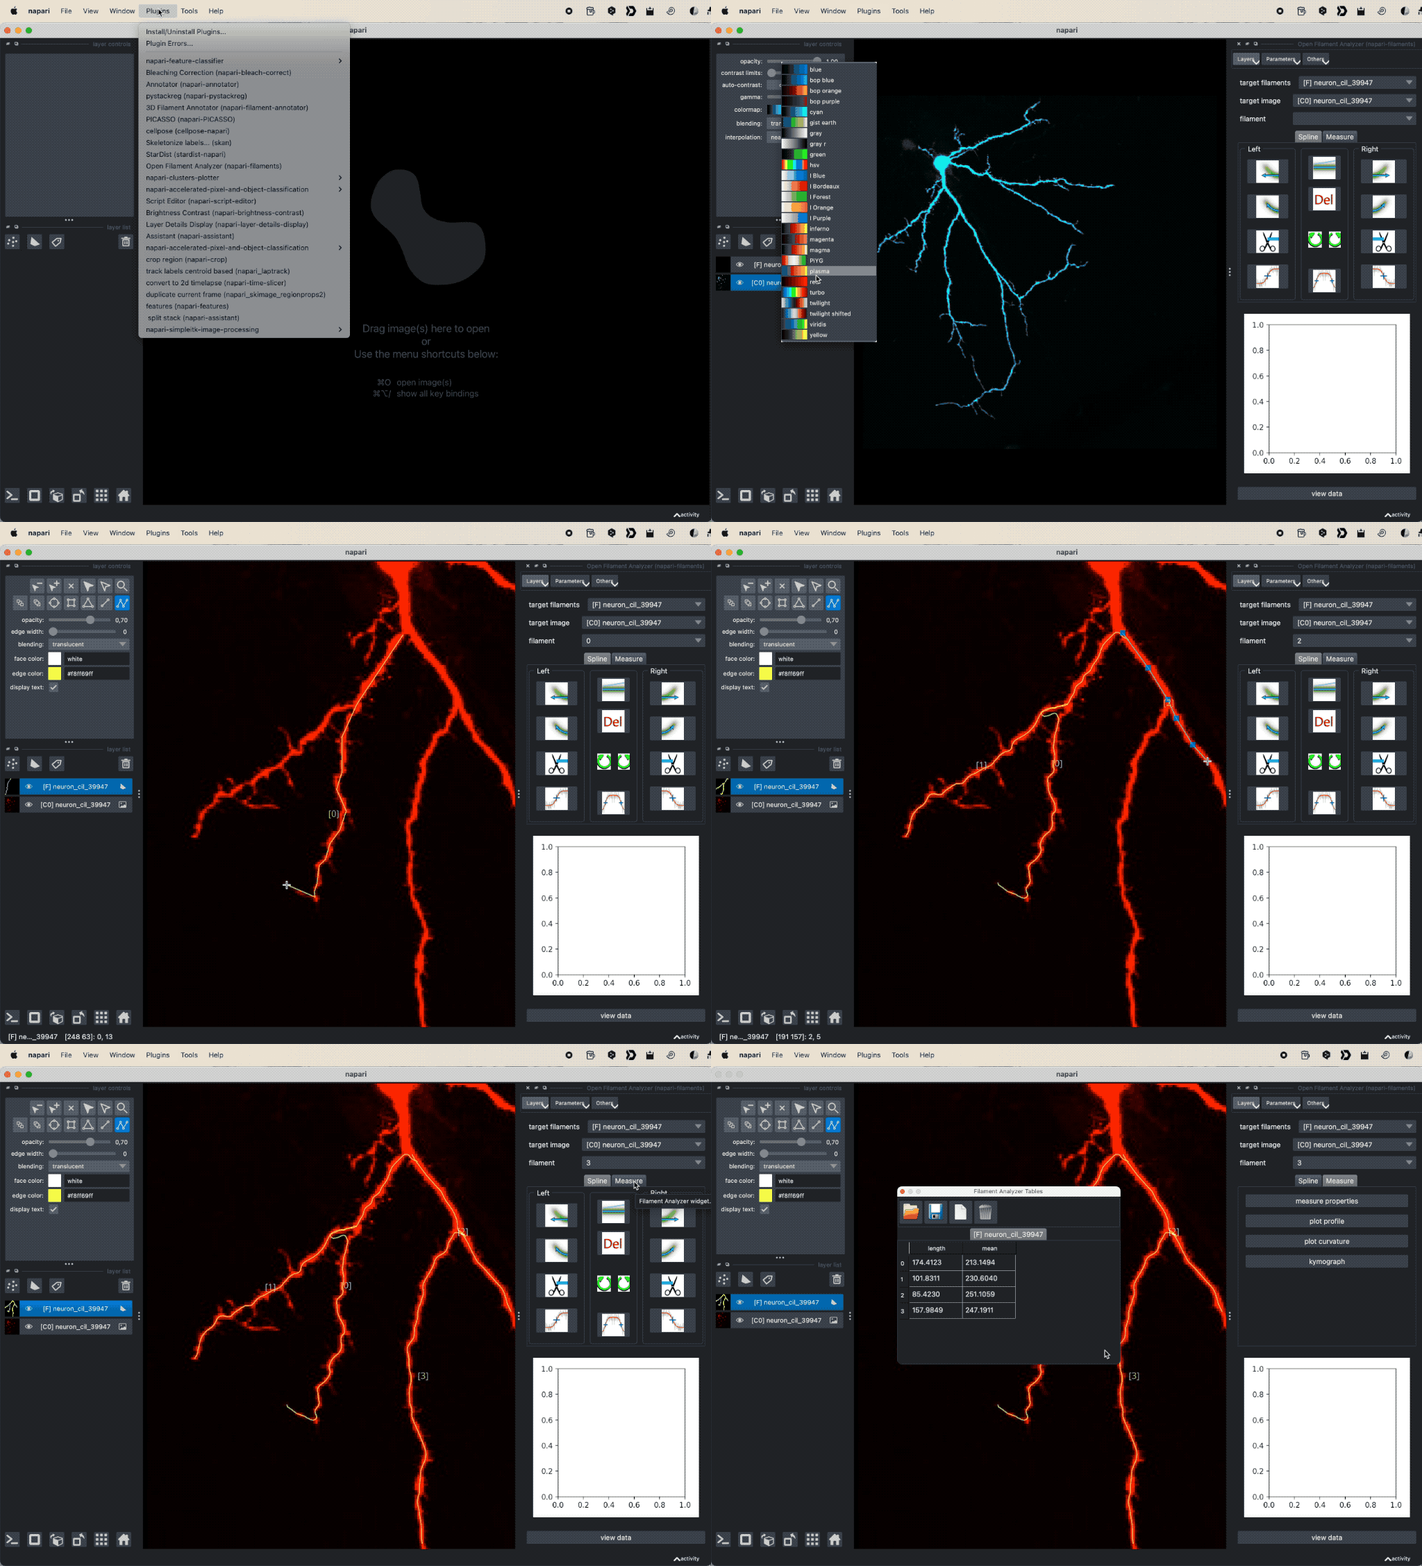 Tracing filaments in 2D images using the Napari napari filaments plugin. The plugin is applied to the
 Cell sample image from the File->Open Sample->napari menu.
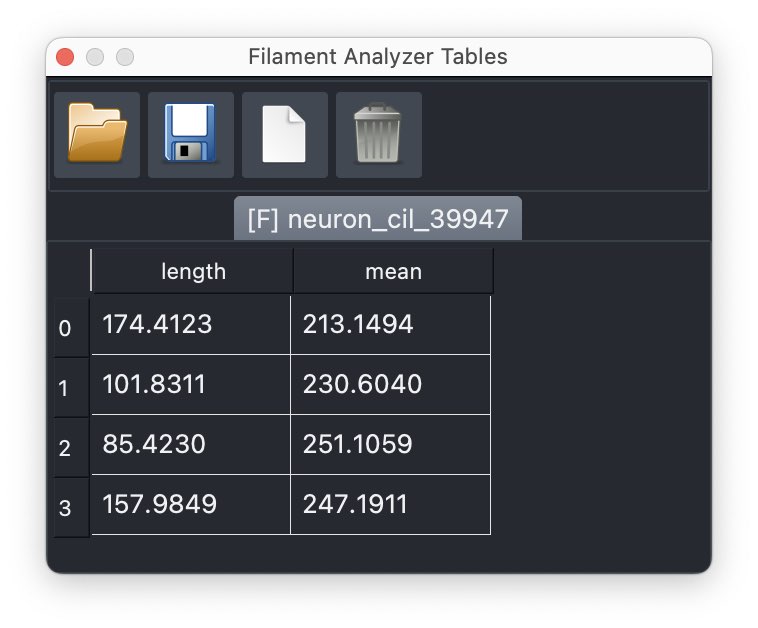 The table containing the lengths of each drawn and fit filament.
3D filament tracing
To trace filaments in 2D images, we can use the Napari 3D filament annotator pluginꜛ. To do so, follow these steps:
- Open the plugin’s widget via
Plugins->3D Filament Annotator. - In the widget, click on
Add annotation layerto create a new annotation layer. - Drag and drop and zoom the image to the desired position and start drawing the filament by pressing the Ctrl/Command key and clicking on the image. The filament will be drawn as a series of connected points, i.e., of your clicks.
- Rotate the image to view the filament from another angle and repeat step 3.
- Rotate the image again: this will calculate the filament position from the intersection of the two polygons.
- Repeat steps 3-5 for other filaments.
- Save final or intermediate annotations to a csv file. via the
sae annotationsoptions of the widget. To reopen and continue to work on the annotations, use theLoad existing annotationsoption. The save CSV file is also the main results table of the analysis, which can be used for further analysis (e.g., calculating the length of each filament, perform a Sholl anaylsis, and so on)
The widget offers the following keyboard shortcuts to edit the annotations:
p: delete the last added point (during the polygon drawing)d: delete the last added shape (polygon or filament)f: delete the first point of the last added filamentl: delete the last point of the last added filament
You can adjust the parameters for detecting and calculating the filaments. Please, find more details about these settings in this tutorialꜛ.
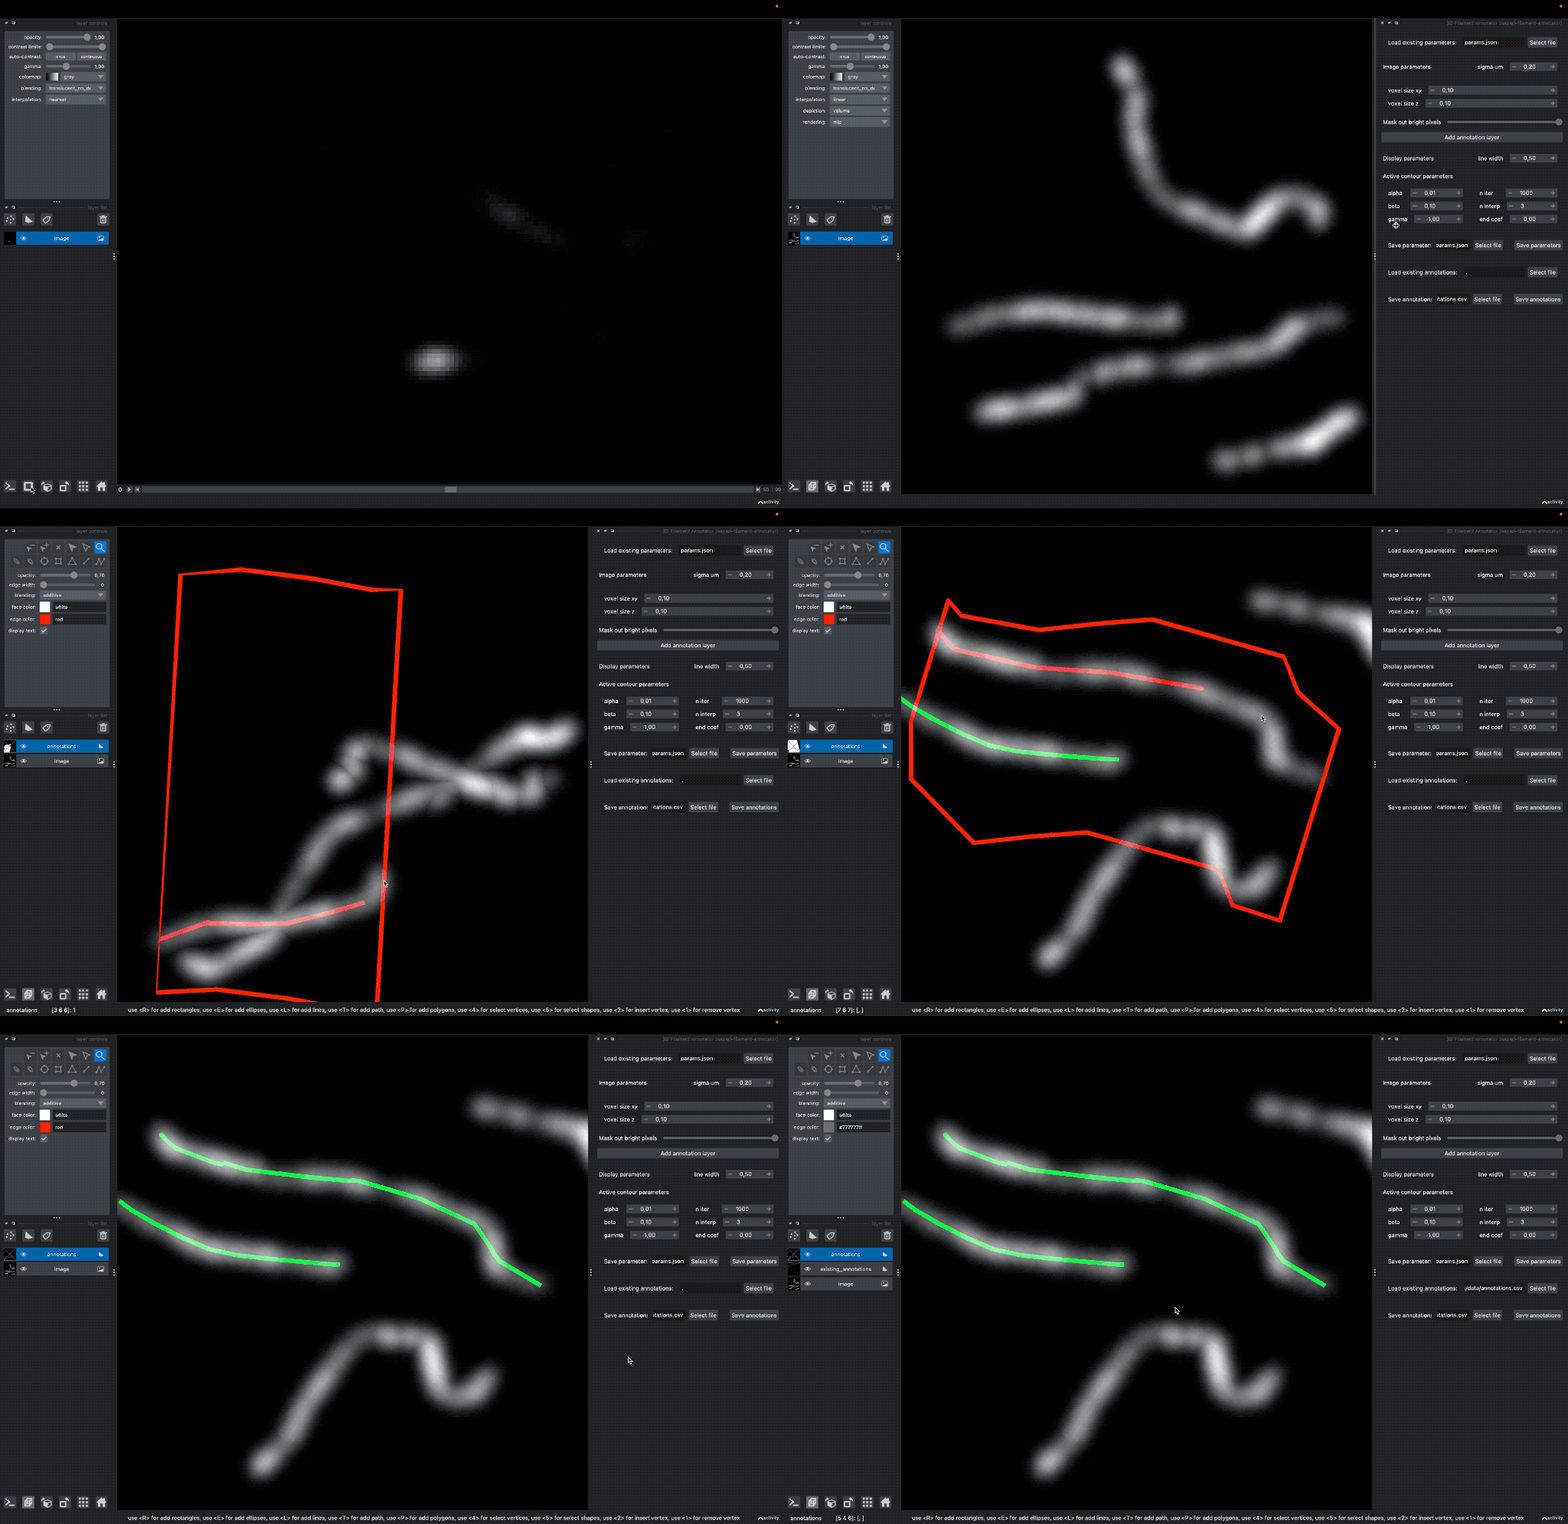 Tracing filaments in 3D images using the Napari 3D filament annotator plugin. The plugin is applied to the plugin’s sample image (
File->Open Sample->Sample image (napari-filament annotator))
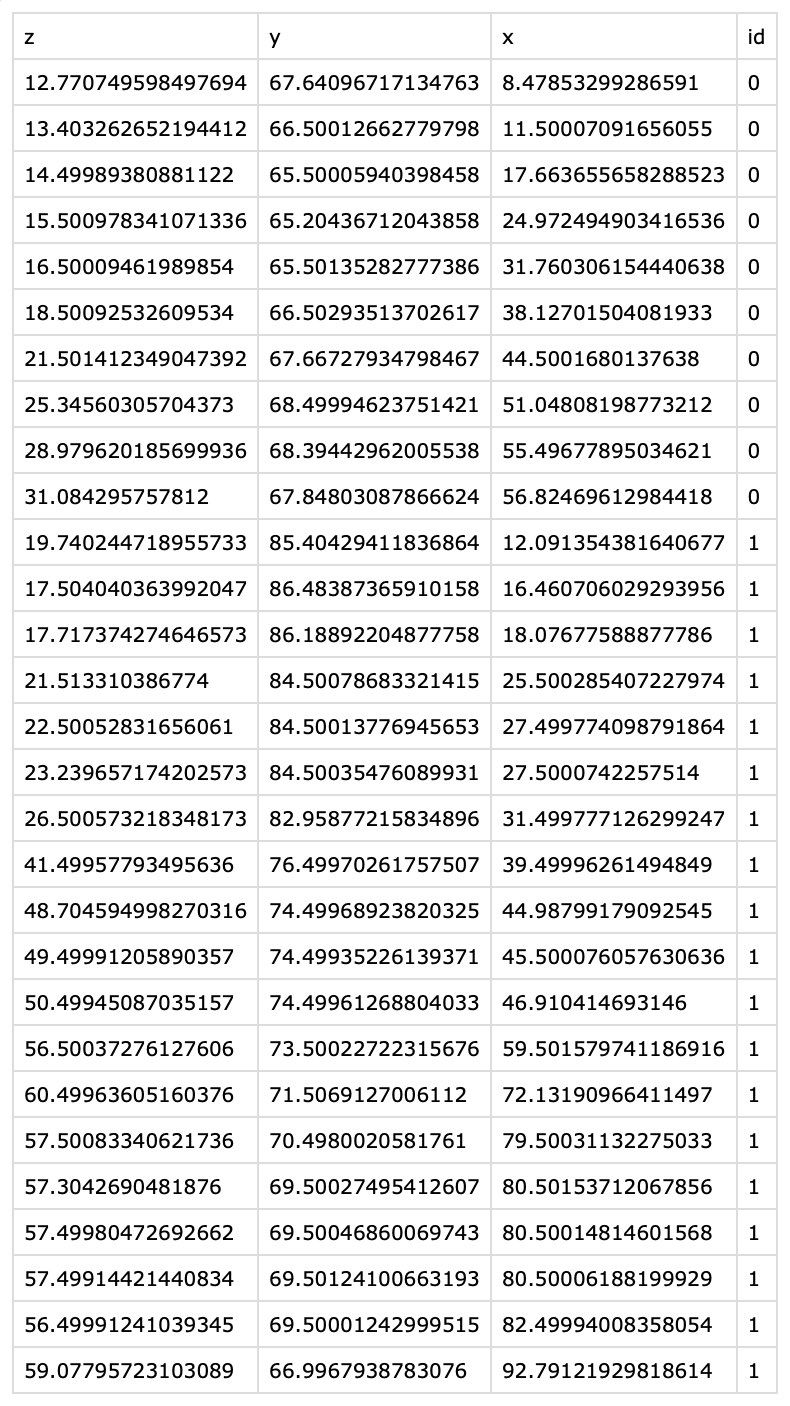 The content of the exported CSV file. The table contains the $x$, $y$, and $z$ coordinates of all clicked support points per filament. The filament ID associated to each coordinate tuple is listed in the
 id column.
